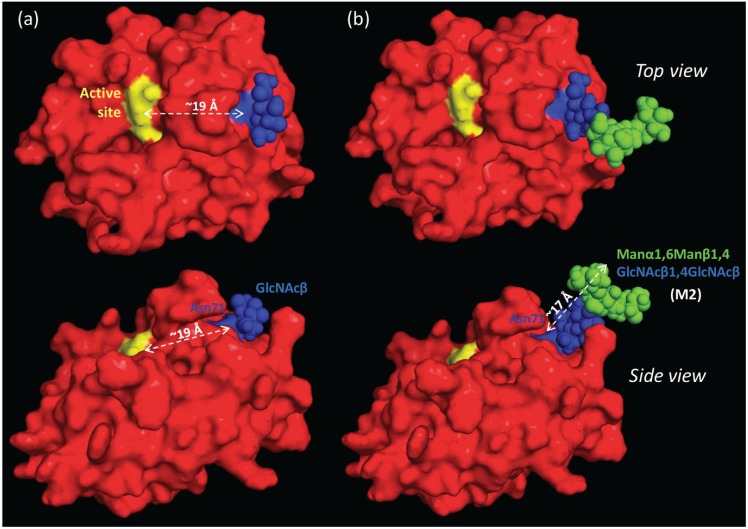
Figure 6.
Top and side view of nCG illustrating the proximity (~19 Å) of the active site to the Asn71-glycosylation site conjugated with (a) GlcNAcβ and (b) M2 (Manα1,6Manβ1,4GlcNAcβ1,4GlcNAcβ). Color scheme: yellow denotes His64, Asp108, and Ser201 forming the active site of nCG; blue denotes the Asn71-glycosylated residue and the conjugated GlcNAc residues; and green denotes mannose residues. The approximate height of the M2 N-glycan (~17 Å) is illustrated.

