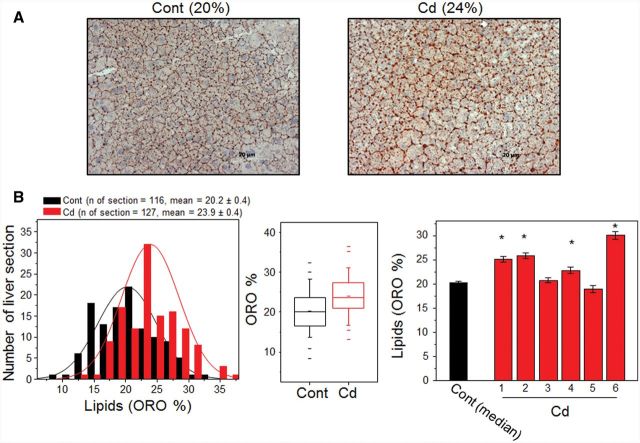
FIG. 3.
Accumulation of lipids in liver of mouse challenged with low-dose Cd. Livers collected from Cd and control (Cont) mice groups were prepared to quantitate lipid accumulation in livers. A, Representative images of lipids stained by ORO in liver sections prepared from Cont and Cd mice. Additional ORO-stained images from Cont and Cd mice are provided in Supplementary Material S4. Quantitation of ORO-stained lipid intensity (% area per image) using NIH image J software is shown by histogram (B left, P = .09), box plot (B middle), and bar graph (B right). Number of image: 116 (cont), 127 (Cd), number of section: 41(cont), 43 (Cd). *P < .05 versus control group [number of section; 8 (Cd mouse1), 8 (Cd mouse 2), 7 (Cd mouse 3), 8 (Cd mouse 4), 6 (Cd mouse 5), 6 (Cd mouse 6), 41 (cont)].

