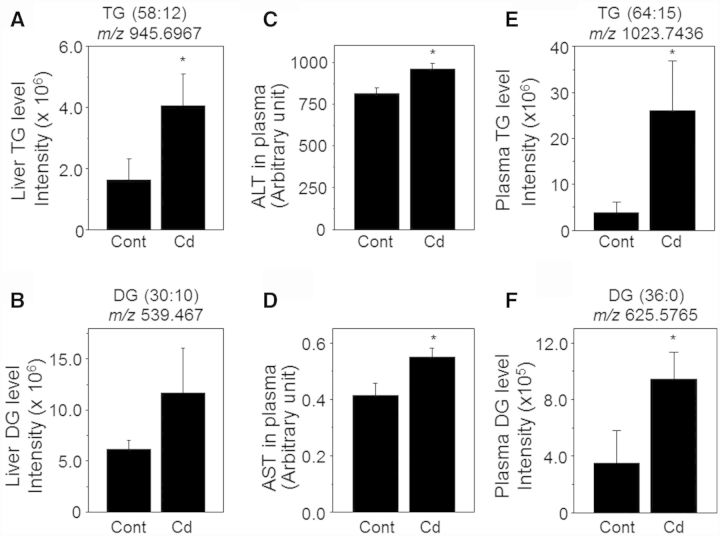
FIG. 4.
Low-dose Cd elevated liver enzymes and plasma lipids. Metabolomics of liver tissues (respective to 250 µg protein) were performed using HRM. Metabolites corresponding to TG (A, E) and DG (B, F) were identified based on mass to charge (m/z) and retention time (RT) by searching Metlin software (https://metlin.scripps.edu/metabo_search_alt2.php). Bar graphs show amount of TG and DG in liver tissue and plasma quantified from intensity of respective peak spectrum. The data are shown as mean ± SE; n = 8. *P < .05 versus control group (Cont). Plasma collected from control and Cd mice groups were analyzed for liver enzymes, alanine aminotransferase (ALT, C) and aspartate aminotransferase (AST, D). Plasma levels of these enzymes were quantified by measuring enzyme activity (box plots). The data are shown as mean ± SE; n = 8. *P < .05 versus control group (Cont).

