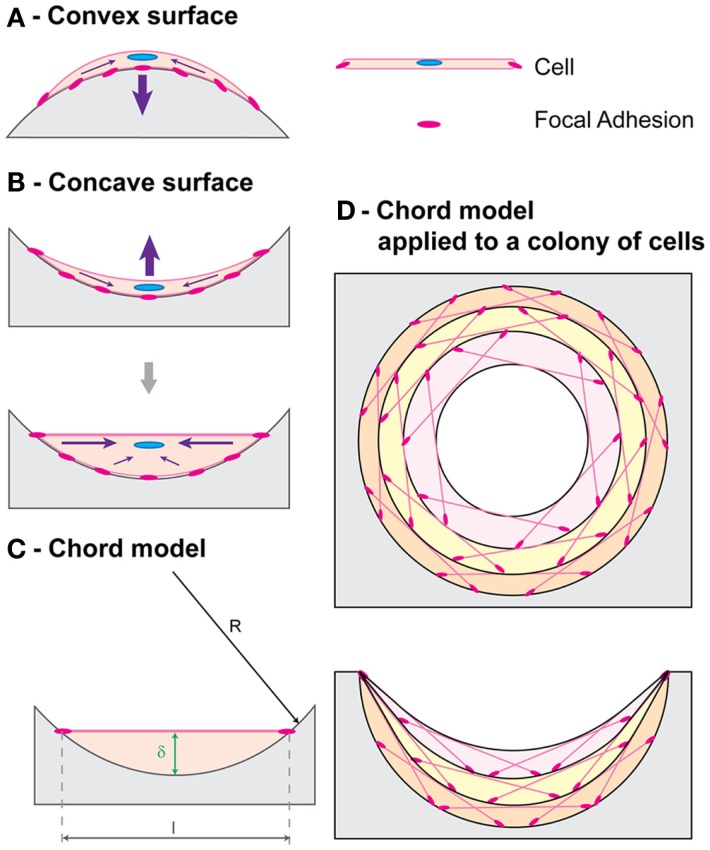
Figure 3.
Chord model. A simple geometric framework for curvature-driven growth developed by Bidan et al. (2012) is shown. Cell contraction (purple arrows) resulting in stable tensile state morphology is depicted for (A) a convex surface and (B) a concave surface. (C) A cell with thickness δ proportional to the local curvature is represented with a chord. (D) Chord segments can be combined to represent tissue growth, with each layer acting as a substrate for the one above. Figure retrieved from Bidan et al. (2012).

