
Figure 2.
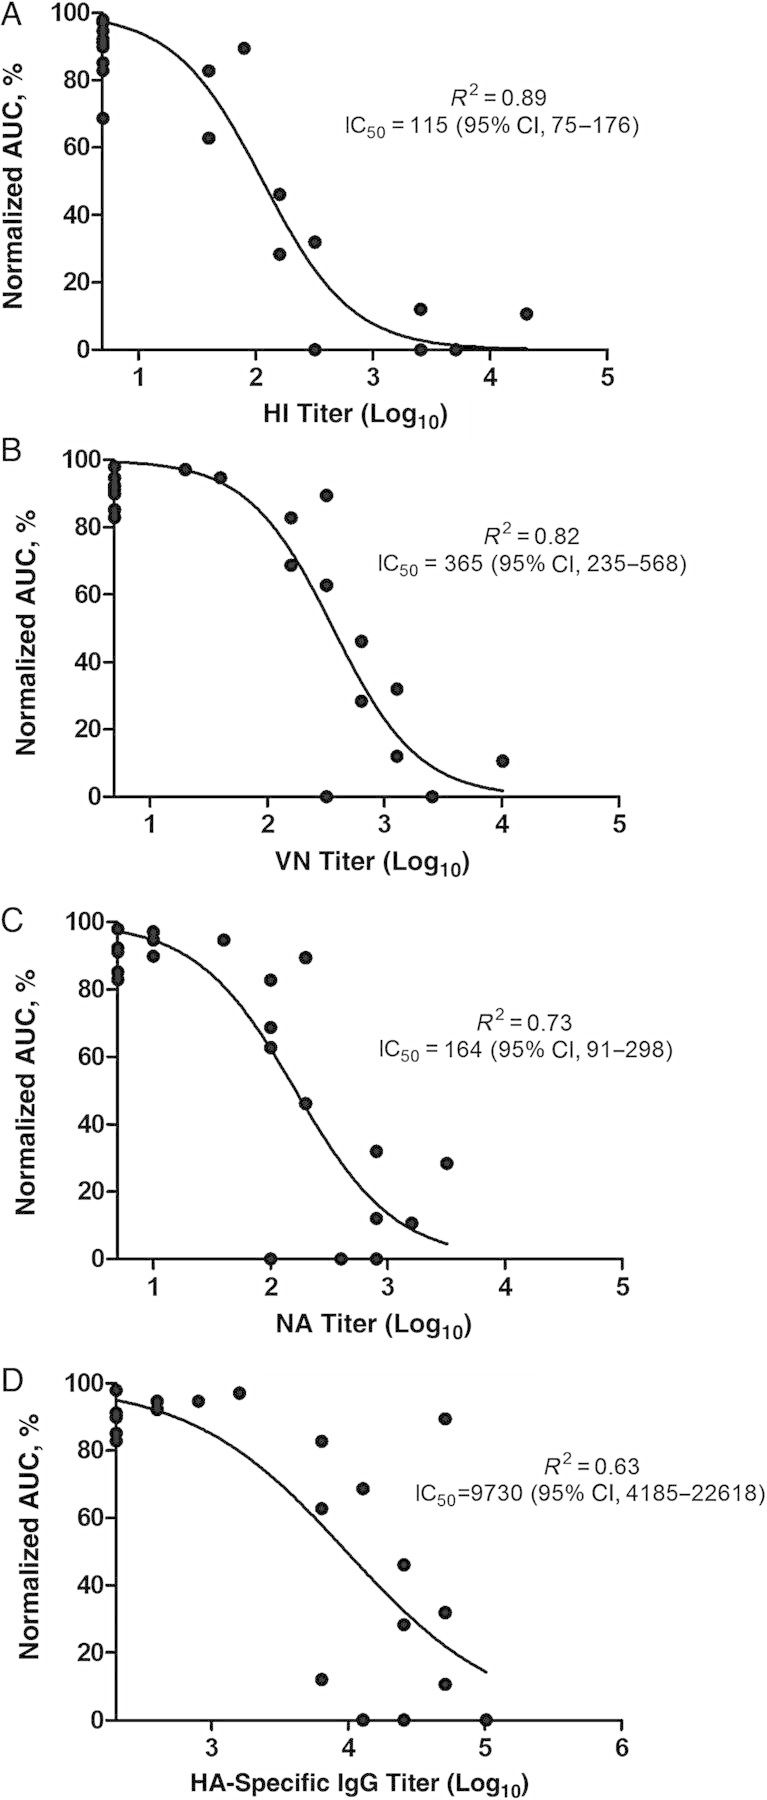
Relationship between hemagglutination inhibition (HI) (A), virus neutralization (VN) (B), neuraminidase (NA) (C), and hemagglutinin (HA)–immunoglobulin (Ig) G antibody (D) titers with total viral load. The x-axes represent log-transformed antibody titers; the y-axes, the area under the curve (AUC) of a viral shedding curve as a measure of cumulative viral load throughout the study period. The AUC values here have been normalized to a percentage, with the minimum and maximum AUCs set to 0% and 100%, respectively. The R2 value indicates the goodness of fit, and the antibody titer that correlates to 50% reduction in total viral load is expressed as the 50% inhibitory concentration (IC50). Abbreviation: CI, confidence interval.