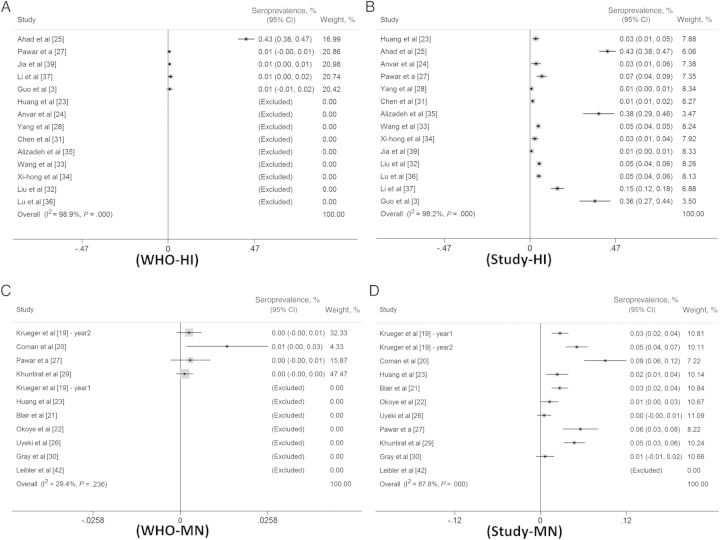
Figure 3.
Forest plots of the overall seroprevalence calculated from hemagglutination inhibition (HI) and microneutralization (MN) assay results, using reported cutoff corresponded with the standard cutoffs recommended by the World Health Organization (WHO) (ie, HI assay titers of ≥1:160, MN assay titers of ≥1:80, or seroconversion, defined as a 4-fold rise in HI or MN titers over time). A, Forest plot of seroprevalence calculated from HI assay results, using the WHO-recommended cutoff (≥1:160). B, Forest plot of seroprevalence calculated from HI assay results, using study cutoffs. C, Forest plot of seroprevalence calculated from MN assay results, using the WHO recommended cutoff (≥1:80). D, Forest plot of seroprevalence calculated from MN assay results, using the study cutoff.

