
Figure 3. Metabolic differences during a night of sleep deprivation compared to a night of sleep (a) OPLS-DA scores and (b) loadings separating NMR spectra of urine samples from a night of sleep deprivation and a night of sleep.
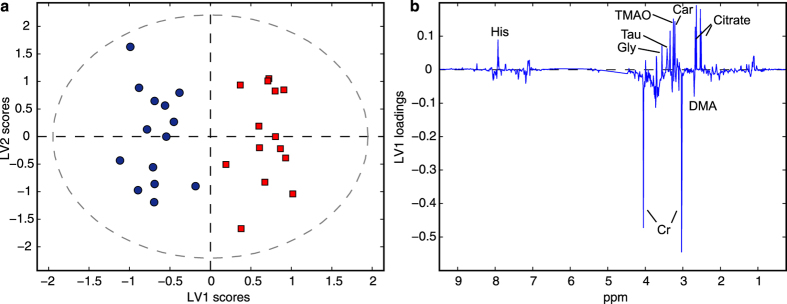
The OPLS-DA model explains 54.1% and 89.5% of x-and y-variation, respectively. Car: carnitine, Cr: creatinine, DMA: dimethylamine, Gly: glycine, His: histidine, Tau: taurine.