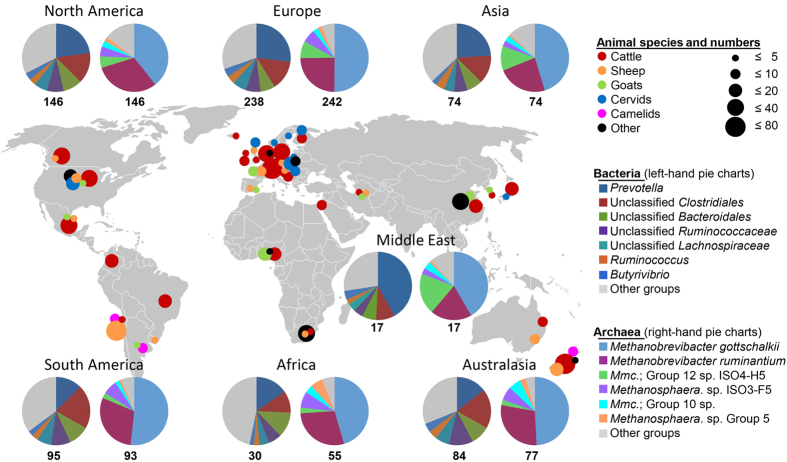
Figure 1. Origins of samples and their bacterial and archaeal community compositions in different regions.
Numbers below pie charts represent the number of samples for which data were obtained. The most abundant bacteria and archaea are named in clockwise order starting at the top of the pie chart. Further details of samples and community composition are given in Supplementary Tables 1, 2, 3, and 4 and Supplementary Data 1. Mmc. Methanomassiliicoccales. The map was sourced from Wikimedia Commons (http://commons.wikimedia.org/wiki/File:BlankMap-World-v2.png, original uploader Roke, accessed May 2013). Pie charts were produced in Microsoft Excel and the composite image generated with Microsoft PowerPoint and Adobe Illustrator. https://creativecommons.org/licenses/by-sa/3.0/deed.en

