
Figure 2.
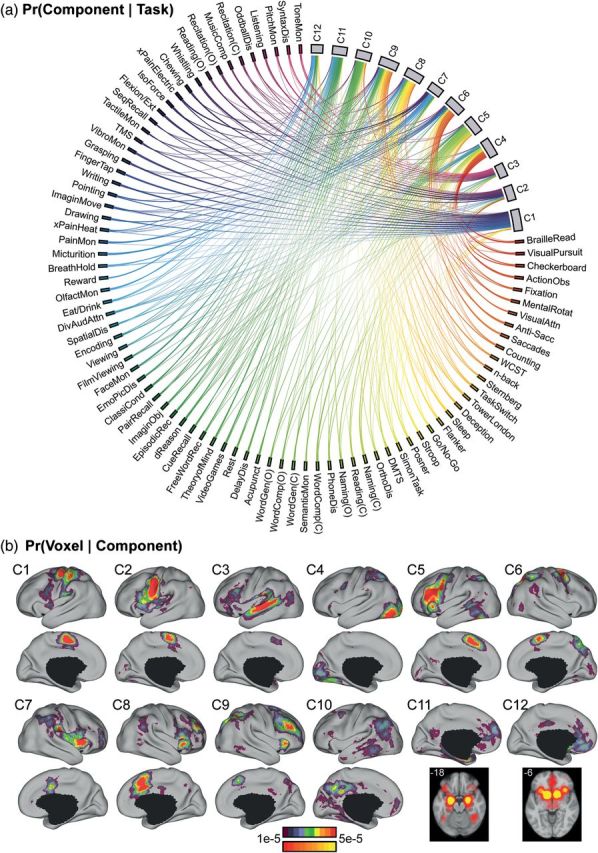
12-component model estimates. (a) Probability of tasks recruiting different components (i.e., Pr(component | task)). The components, C1 to C12, lie on the top right. The 83 tasks lie in the remaining segments of the circle. Each line connects 1 task with 1 cognitive component. The thickness of the lines is proportional to the magnitude of Pr(component | task). For the purpose of visualization, tasks with similar Pr(component | task) are more closely positioned and their lines were assigned similar colors. Only lines corresponding to Pr(component | task) > 1/12 are shown. (b) Probability of components activating different brain voxels (i.e., Pr(voxel | component)). The cerebral hemisphere with the stronger activation is shown, although most components have high probabilities of bilateral activation. An exception is component C5, which has high probability of activating the left, but not the right, cerebral cortex. Many components, especially C11 and C12, activate subcortical regions. Component C7 had high probability of activating the brainstem (Supplementary Fig. 2). The top color bar is utilized for the surface-based visualization of Pr(voxel | component), whereas the bottom color bar is utilized for the volumetric slices highlighting subcortical structures shown for components C11 and C12. Additional slices highlighting subcortical structures are found in Supplementary Figure 2. (C) indicates “covert” and (O) indicates “overt”. An interactive version of the model estimates and the unthresholded estimates for 10-component to 14-component estimates are available: https://surfer.nmr.mgh.harvard.edu/fswiki/BrainmapOntology_Yeo2015, last accessed September 12, 2014.