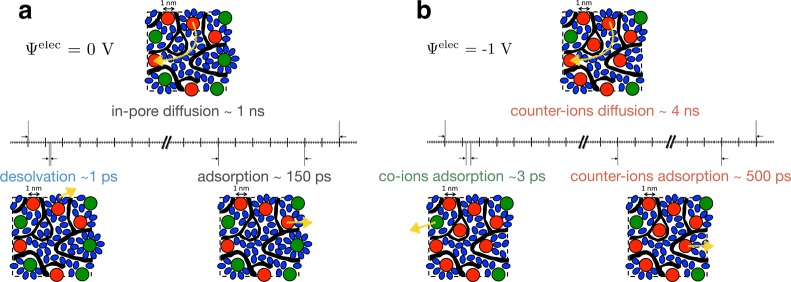
Figure 6.
Summary of the various characteristic times extracted from the simulations for electrodes held at 0 V (a) and −1 V (b). The black regions represent the porous carbon; red, green, and blue spheres/ellipses represent adsorbed cations, anions, and acetonitrile molecules, respectively. The characteristic dynamic processes are shown with yellow arrows.

