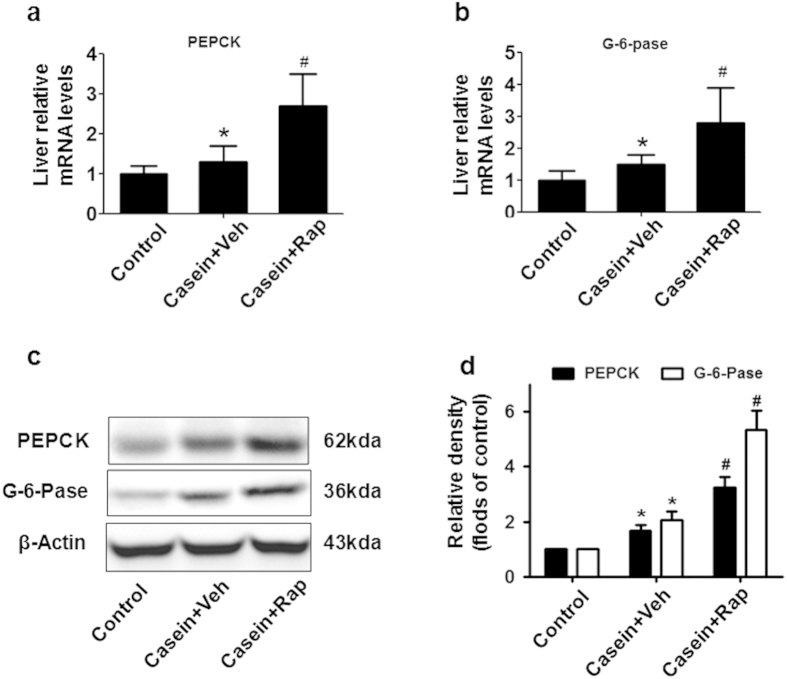
Figure 6. Rapamycin treatment enhanced hepatic gluconeogenesis.
(a) PEPCK and (b) G-6-Pase mRNA expression in the liver of C57BL/6J mice. The graphs depict mRNA expression in the liver of target genes corrected for the expression of β-actin as the housekeeping gene. (c) Representative western blotting of PEPCK and G-6-pase proteins in the liver. (d)The histogram represents the mean ± SD (n = 3) of the densitometric scans for protein bands from three experiments, normalized by comparison with β-actin, and expressed as folds of control. *P < 0.05 versus control, #P < 0.05 versus casein plus vehicle.

