
Figure 1. Frequencies of observed nucleotide changes.
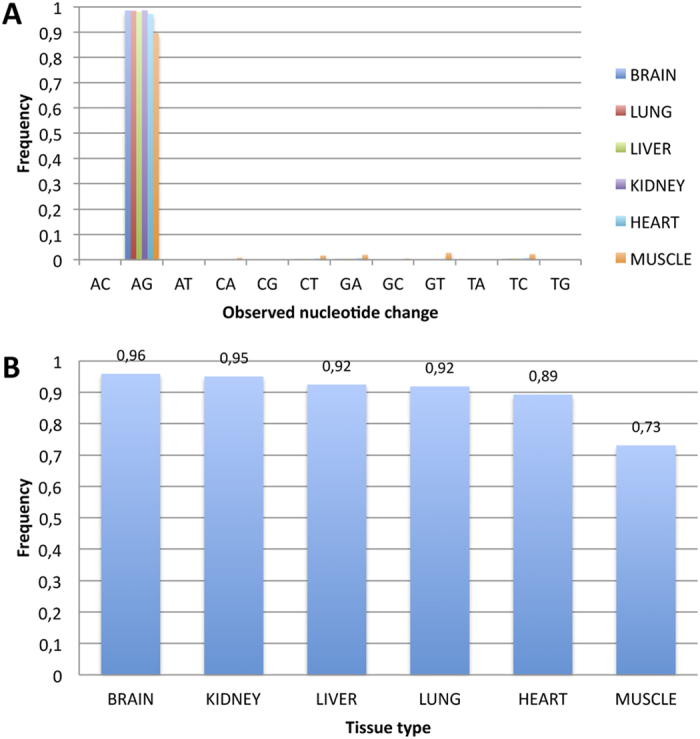
(A) Most of the detected RNA editing events were A-to-G. Potential non canonical events were rare and showed frequency values less than 0.05. (B) The fraction of A-to-G changes in non-synonymous sites across tissues.