
Figure 5. RNA editing in human tissues.
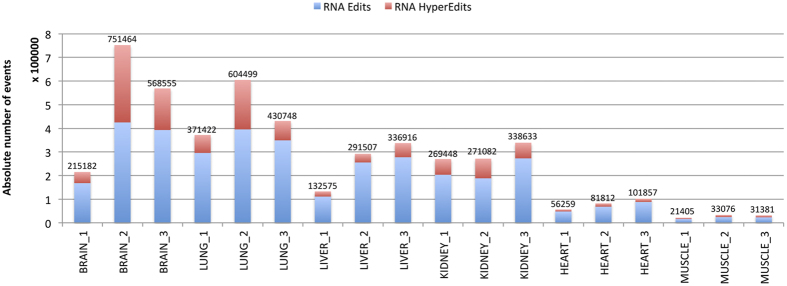
Distribution of detected RNA editing events across human tissues. The absolute number of events is reported on the top of each bar. The fraction of hyper edited sites is indicated in red.
Official websites use .gov
A
.gov website belongs to an official
government organization in the United States.
Secure .gov websites use HTTPS
A lock (
) or https:// means you've safely
connected to the .gov website. Share sensitive
information only on official, secure websites.
Distribution of detected RNA editing events across human tissues. The absolute number of events is reported on the top of each bar. The fraction of hyper edited sites is indicated in red.