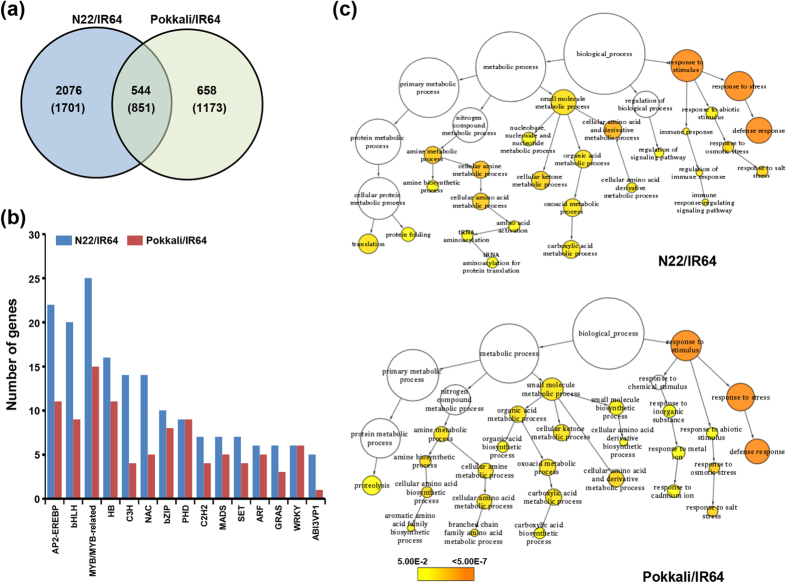
Figure 4. Differential gene expression among the rice cultivars and gene ontology (GO) enrichment analysis.
(a) Venn diagram showing number of differentially expressed genes in N22/IR64 and Pokkali/IR64. Number of upregulated and downregulated (in parentheses) genes are shown. (b) Number of genes from top 15 transcription factor families represented in the differentially expressed genes in N22/IR64 and Pokkali/IR64. (c) GO enrichment analysis of genes showing differential expression in N22/IR64 and Pokkali/IR64. The significantly enriched GO terms are highlighted in different colours as per scale (P-value) given at the bottom.

