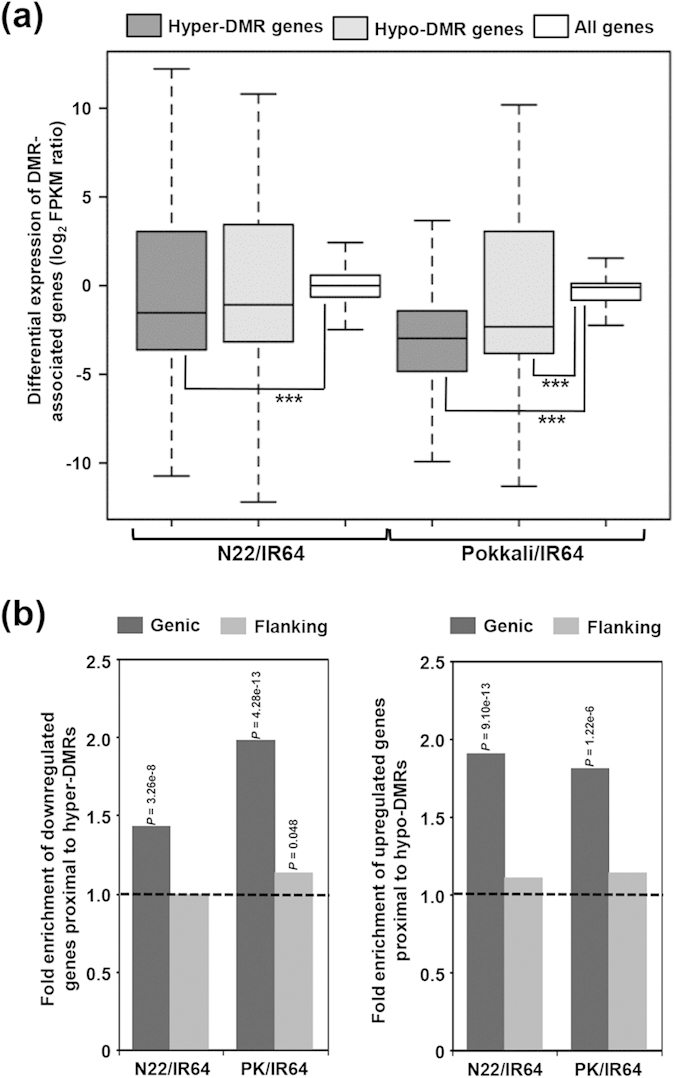
Figure 5. Relationship between differential methylation and transcript abundance of protein-coding genes.

(a) Box-plot showing differential expression levels of all the genes or genes associated with hyper/hypo methylated DMRs are displayed. Significant differences (Fisher’s exact text) are marked with asterisks (***P < 1 × 10⁻¹⁰). (b) Enrichment of downregulated and upregulated genes proximal to hypermethylated and hypomethylated DMRs, respectively, positioned within the protein-coding genes (genic DMRs) or flanking (flanking DMRs) sequences. Significance (P-value by Fisher’s exact test) of the enrichment has been given. N22, Nagina 22; PK, Pokkali.
