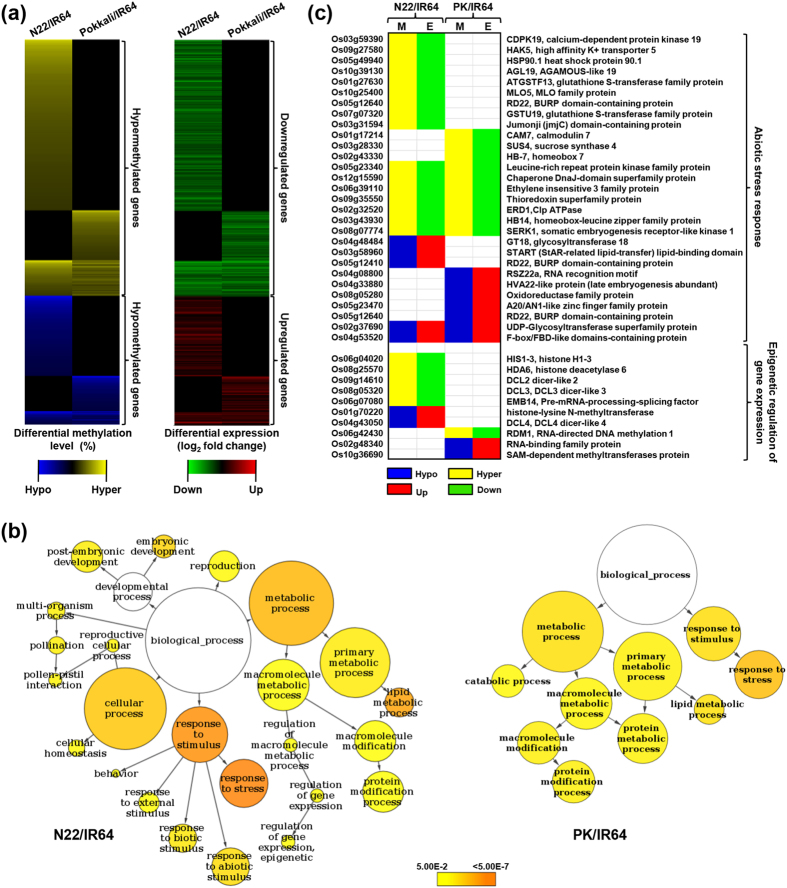
Figure 6. Differential methylation, transcript abundance and gene ontology enrichment of protein-coding genes.
(a) Heatmap representation of the differential methylation levels and differential expression of DMR-associated genes showing negative correlation. Color scales at the bottom represent status of methylation and transcript abundance. (b) GO enrichment analysis of DMR-associated genes showing differential expression. The significantly enriched GO terms are highlighted in different colours as per scale (P-value) given at the bottom. (c) Heatmap representation of the differential methylation (M) and differential expression (E) of DMR-associated genes known to be involved in abiotic stress response and epigenetic regulation of gene expression. Gene identifiers (MSU v7) and gene descriptions (best Arabidopsis ortholog) are given on the left and right sides of the heatmap, respectively. Colors at the bottom represents status of differential methylation (hypo/hyper) and differential expression (up/down). N22, Nagina 22; PK, Pokkali.

