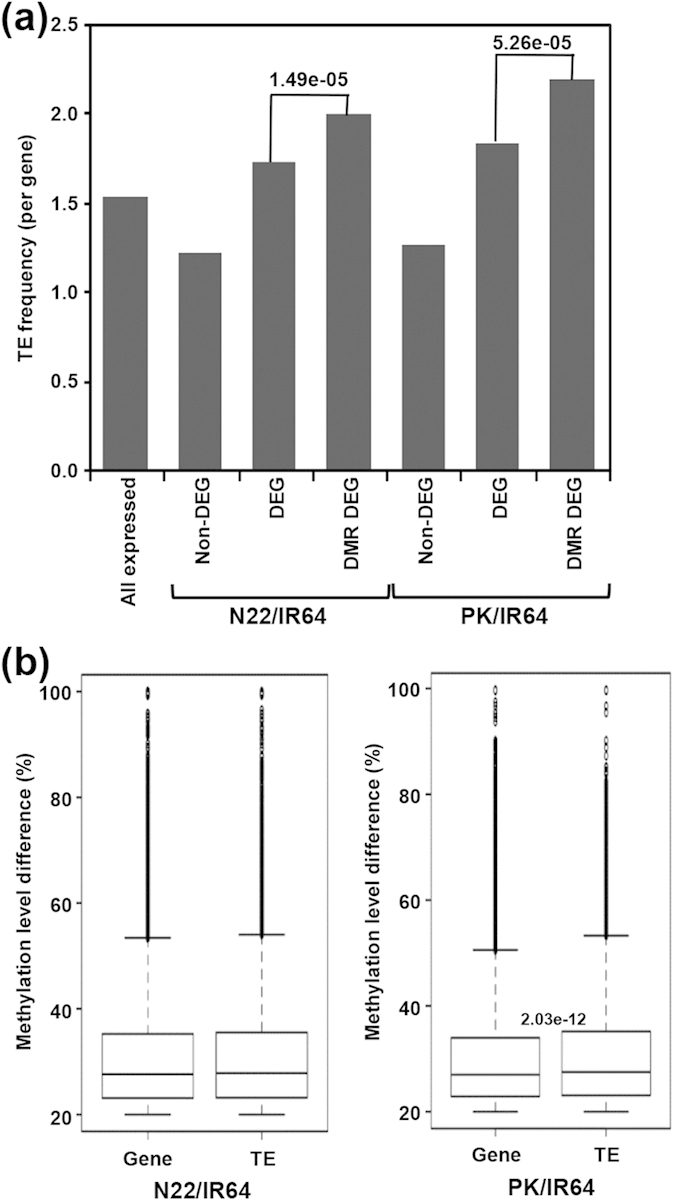
Figure 7. Correlation between differential expression and frequency/methylation level of TEs.

(a) Average number of TEs per gene (within 2 Kb flanking sequences) for the indicated gene class. Non-DEG, non-differentially expressed genes; DEG, differentially expressed genes; DMR-DEG, differentially expressed genes associated with DMRs. (b) Box-plot showing distribution of methylation level difference of the differentially methylated regions (DMRs) associated with protein-coding genes and transposable elements (TEs) in different rice cultivars. P-value (Fisher’s exact text) of significant methylation difference is given. N22, Nagina 22; PK, Pokkali.
