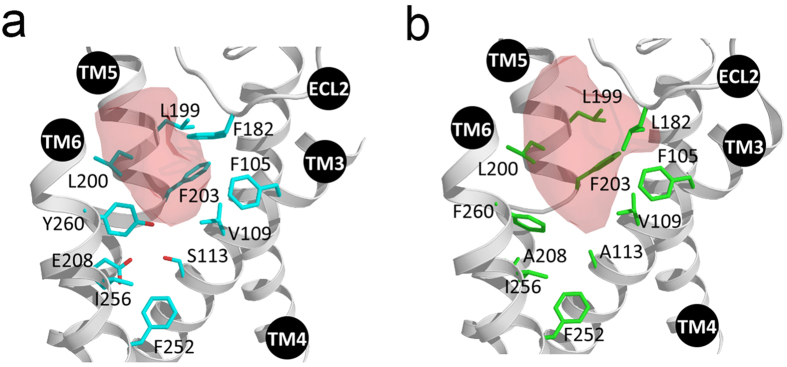
Figure 4. Comparison of binding cavity volumes of Olfr73 and Olfr74.

Close-up view of 3D models showing the odorant binding cavities of (a) Olfr73 and (b) Olfr74. Residues are shown in blue and green. Numbers refer to the OR amino acid sequence. The binding cavity volumes are shown as red shaded areas.
