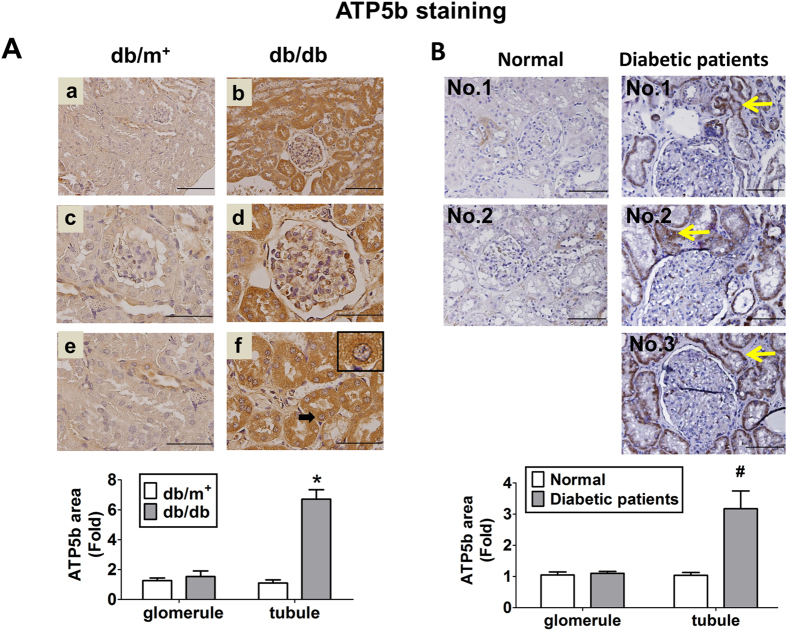
Figure 2. Immunohistochemical staining for ATP5b in the kidneys of diabetic db/db mice or patients.
The immunohistochemical staining for ATP5b was performed on the renal sections of diabetic db/db mice (A) or diabetic patients (B). In diabetic db/m+ or db/db mice, low magnification field of vision were shown as (A-a) and (A-b); glomeruli were shown in (A-c) and (A-d); proximal tubules were shown as (A-e) and (A-f). Scale bar: 50 μm. In B, the arrow indicated the representative area of ATP5b expression in the renal tissues of diabetic patients. The semi-quantitative assessment of immunohistochemistry with three random areas per section was determined by ImageJ software. Data are presented as means ± SEM (n ≥ 6). *P < 0.05, db/db versus db/m+; #P < 0.05, diabetic patients versus normal subjects.

