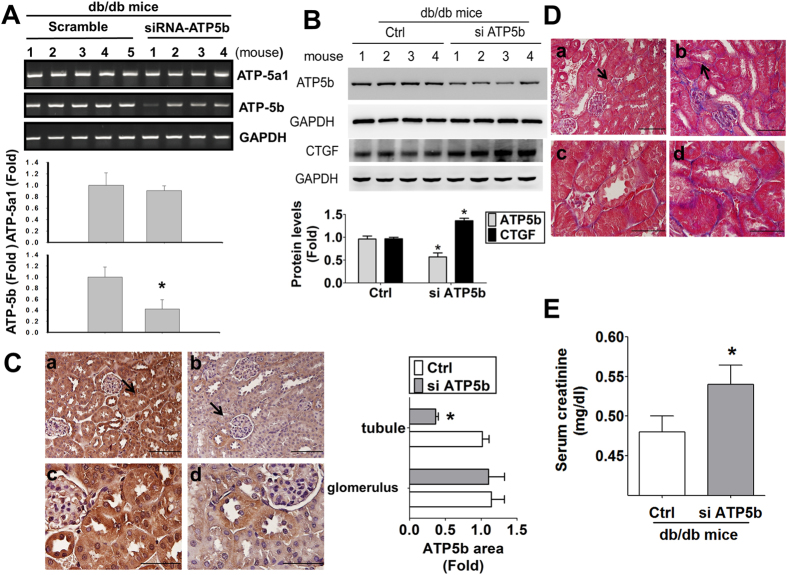
Figure 9. ATP5b siRNA in vivo injection increased renal fibrosis and serum creatinine in the kidneys of db/db mice.
(A) ATP5b and homologous member ATP5a1 mRNA detection. The mRNA expressions of ATP5b and ATP5a1 in the kidneys of diabetic db/db mice were determined by real-time PCR. Data are presented as means ± SEM (n ≥ 4). *P < 0.05, scramble control group versus ATP5b siRNA group. (B) The protein expressions of ATP5b and CTGF were determined by Western blotting. Four representative mice per group were shown. Protein levels of immunoblotting were quantificated by densitometry and normalized by GAPDH levels. Data were presented as means ± SEM (n = 8). *P < 0.05, siRNA versus control (scramble). (C) Immunohistochemical staining for ATP5b in the kidneys of db/db diabetic mice with in vivo siRNA delivery. a and c: control (scramble), b and d: ATP5b siRNA; a and b: scale bar = 100 μm; c and d: scale bar = 50 μm. The arrow showed that indicated areas have enlarged scales in (C-c) and (C-d). The semi-quantitative assessment of immunohistochemistry with three random areas per section was determined by ImageJ software. (D) Masson’s Trichrome staining detected the renal fibrosis in siATP5b injected diabetic mice. The arrow showed that indicated areas have enlarged scales in (D-c) and (D-d). a and c: control (scramble), b and d: ATP5b siRNA; a and b: scale bar = 100 μm; c and d: scale bar = 50 μm. (E) The serum creatinine levels in db/db diabetic mice with in vivo siRNA delivery. Data are presented as means ± SEM (n = 6). *P < 0.05, siATP5b versus control (scramble).

