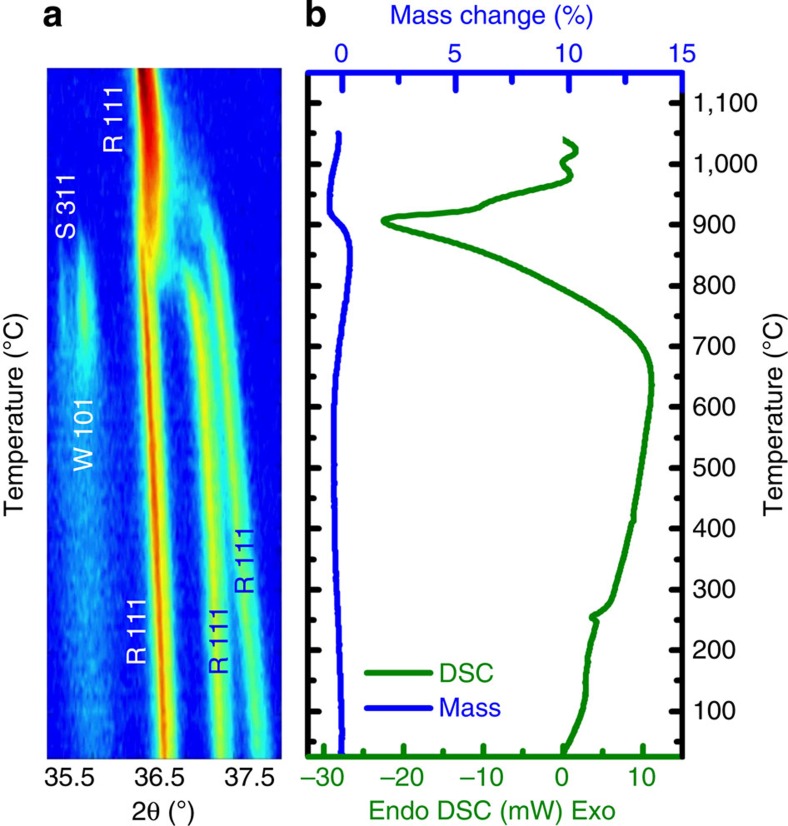
Figure 3. Demonstrating endothermicity.
(a) In situ X-ray diffraction intensity map as a function of 2θ and temperature; and (b) differential scanning calorimetry trace for formulation ‘E1'. Note that the conversion to single phase is accompanied by an endotherm. Both experiments were conducted at a heating rate of 5 °C min−1.

