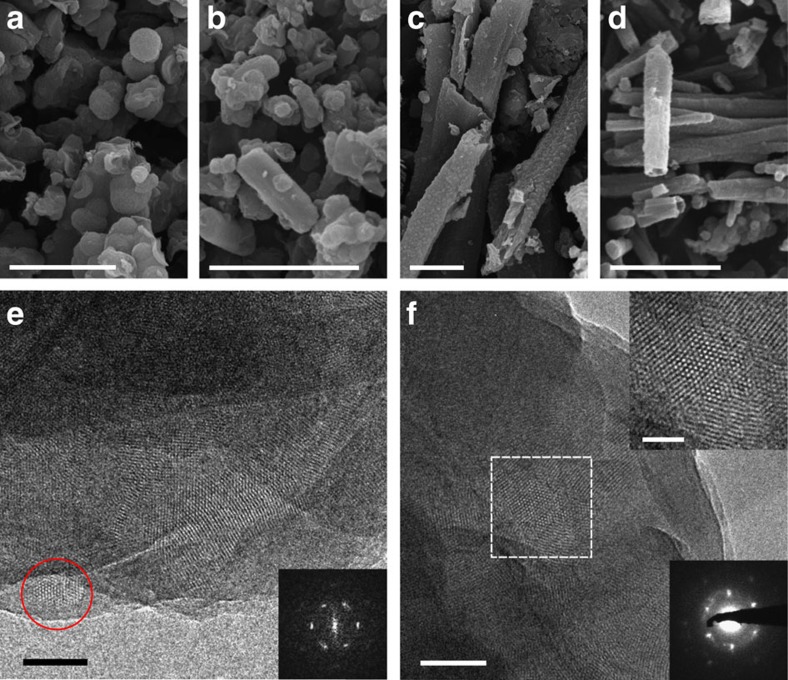
Figure 4. SEM and TEM images of Nx–COFs.
(a) SEM images of N0–COF, (b) N1–COF, (c) N2–COF and (d) N3–COF indicating morphological variation along the series. (e) TEM image of N2–COF showing hexagonal pores, with fast Fourier transform (FFT) of the marked area (red circle) in the inset. (f) TEM image of N3–COF with enlarged Fourier-filtered image (upper inset) of the marked area and representative selected area electron diffraction pattern (lower inset). Scale bars, 5 μm (a,b,c,d); 50 nm (e and f); 20 nm (f, upper inset).

