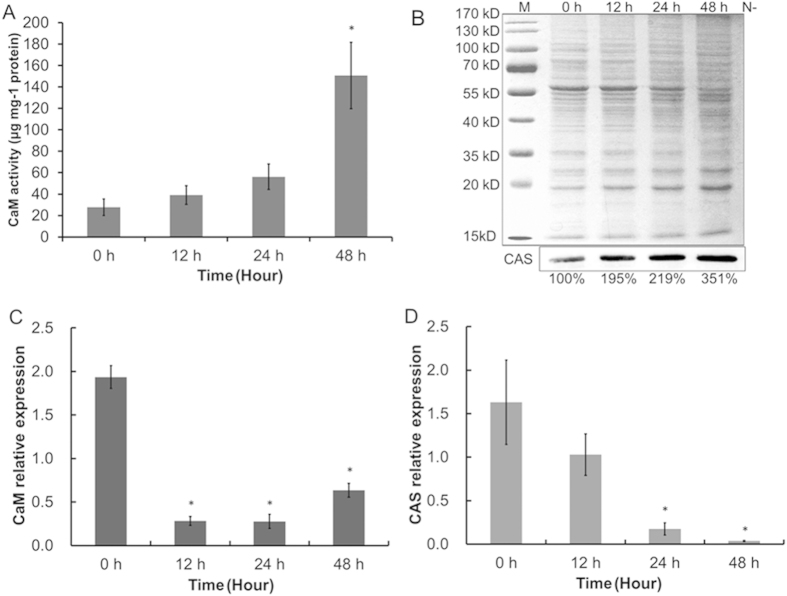
Figure 6. Protein level and gene transcript levels of CaM and CAS in Chlamydomonas reinhardtii 137AH under N starvation.
Protein level of CaM (A) and CAS (B) were detected using CaM active enzyme continuous reaction spectrophotometry and immunoblotting, and control (0 d of C. reinhardtii 137AH) value of CAS activity was set to 100% for easy comparison. Gene transcript levels of CaM (C) and CAS (D) were detected using real-time RT-PCR after 0 h, 12 h, 24 h, and 48 h of N starvation. B, M, protein marker.

