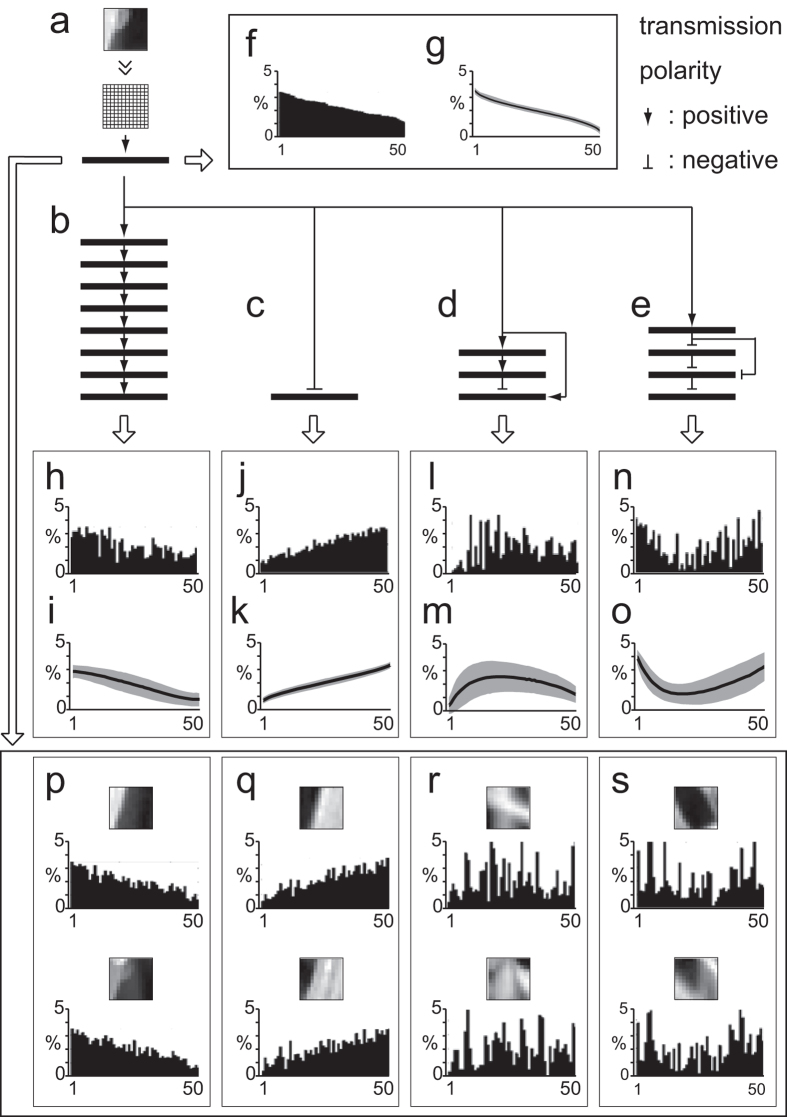
Figure 5. Transformation of active-gene arrays by various GMNs.
Various GMNs (GR = 50, GE = 5) were used. Transmission polarities are specified by arrows (positive) and bars (negative). (a) Template image and common layers (1 and 2). AP (layer 2) = 50%. (b) AP (layers 3-10) = 50%. (c) AP (layer 3) = 50%. (d) GMN representing the cerebellar network, with layers 2-5 corresponding to the pontine nuclei, granule cell layer, Purkinje cell layer, and cerebellar nuclei, respectively. AP (layers 3-5) = 25%. The combination ratio between main and side branches was 1:2. (e) GMN representing the basal ganglia, with layers 3-6 corresponding to the striatum, external globus pallidus, substantia nigra pars reticulata, and thalamic nuclei, respectively. AP (layers 3, 4, 5, 6) = 25, 10, 25, 25%, respectively. The combination ratio between main and side branches was 1:2. (f) The active-gene array of layer 2, aligned in descending order, called the input order. (g) The active-gene array in layer 2 averaged over 5,000 candidate images (s.d., gray area). (h,j,l,n) The active-gene arrays at the last layer of GMNs (b,c,d,e) respectively. (i,k,m,o) The active-gene arrays averaged over the 5,000 images at the last layer of GMNs (b,c,d,e) respectively (average, solid line; s.d., gray area). (p–s) Sample images listed according to the similarity of their active-gene array at layer 2 to the active-gene array of the template image in the last layer of GMNs (b,c,d,e) respectively. The active-gene arrays shown in h-s were re-aligned in the input order.

