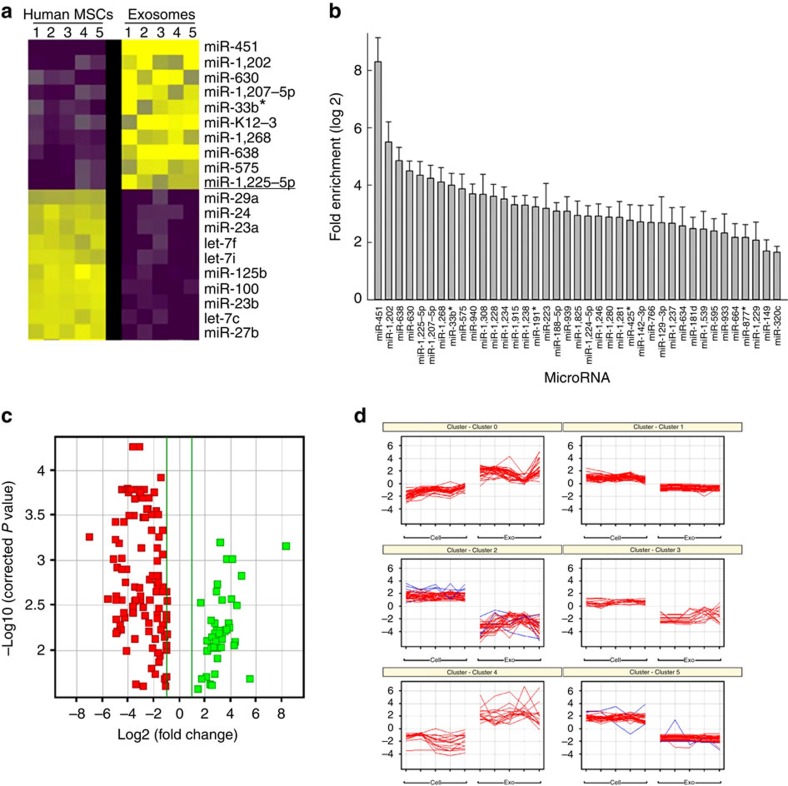
Figure 6. RNA expression profile in human MSCs and their exosomes.
(a) Heatmap illustrating the 10 microRNAs most highly enriched in human MSCs versus their corresponding exosomes. Every row represents a microRNA and every column a cell or exosome, and yellow and purple represent increased or decreased expression, respectively. (b) Plotted values represent the means log 2 fold enrichment of exosomal versus human MSC microRNAs (n=5 microarrays of different MSCs cell lines; P<0.05, ANOVA followed by Holm–Sidak post hoc pairwise comparisons). (c) Data in b show distribution of differentially expressed microRNAs between samples based on the –log base 10 significant P value (<0.05) and with a relative fold change of >2 (in log base 2). Green and red squares represent increasingly and decreasingly expressed microRNAs, respectively, in exosomes versus human MSCs. (d) Computational analysis of human MSCs and exosomes from five donors demonstrates that microRNAs isolated in exosomes cluster among different donors.

