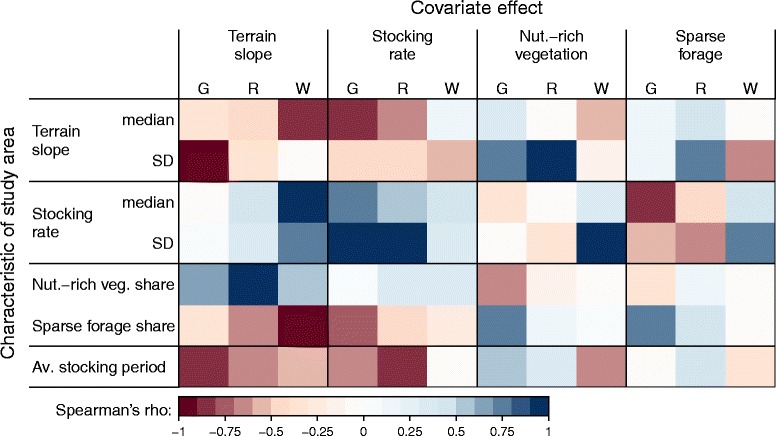
Fig. 6.

Strength and direction of association between covariate effects and characteristics of study areas. Colours represent Spearman’s rank correlation coefficients between covariate effects (the estimated regression coefficients for the activities of grazing (G), resting (R), and walking (W) displayed in Fig. 4) and characteristics of the study areas (medians and standard deviations of slope and stocking density and the average stocking period per paddock given in Table 1, as well as the areal share of nutrient-rich vegetation and sparse forage)
