
Fig. 1.
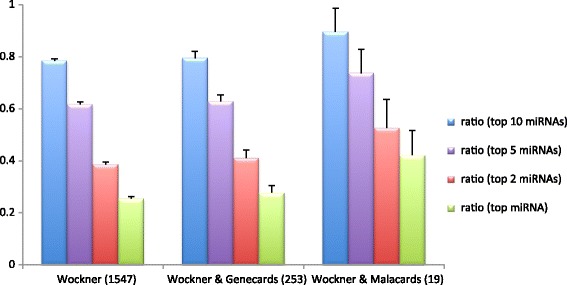
The ratio of genes regulated by the top ten (blue), top five (purple) or top two (red) microRNAs and by the top microRNA (green), respectively, for various data sets. The Wockner data set refers to data set 2 in [6] that are combined with genes listed in Genecards and Malacards, respectively. The error bars show standard deviations acquired via random selection of 155 (1/10th of all genes), 253 (overlapping genes with Genecards) or 19 genes (overlap with Malacards), respectively (repeated 1000 times for each value), each time calculating the ratio of genes that are regulated by the top 10, 5, 2 or 1 microRNAs