
FIGURE 5.
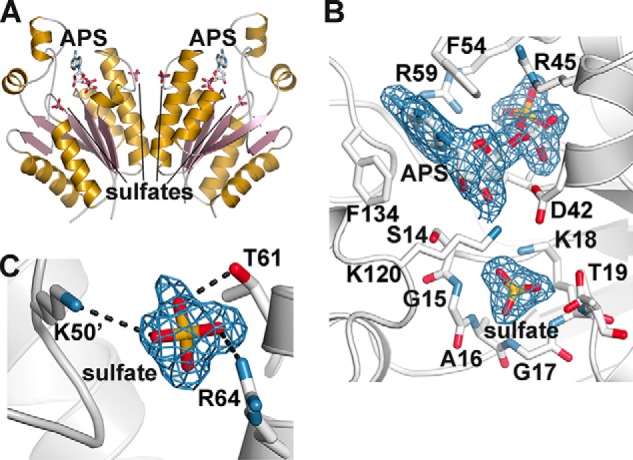
Structure of the SynAPSK·APS·sulfate complex. A, ribbon diagram of the dimer. Secondary structure features are colored as described in the legend for Fig. 3A. The positions of APS and sulfates are indicated. B, view of APS and sulfate binding in the SynAPSK active site. Electron density of the 2Fo − Fc omit map (1.5 σ) for APS and sulfate is shown. C, the sulfate binding site at the dimer interface of SynAPSK. The 2Fo − Fc omit map (1.5 σ) for the sulfate molecule is shown.