FIGURE 5.
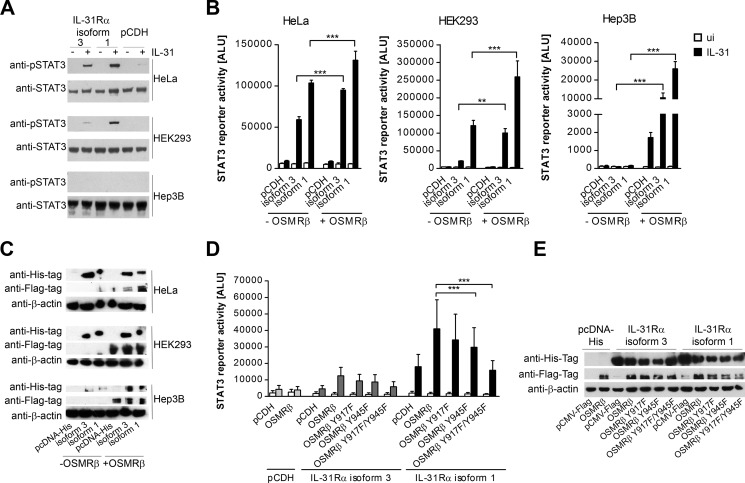
OSMRβ is required for functional IL-31 signaling. A, HeLa, HEK293, and Hep3B cells, transfected to transiently express the short isoform 3 or the long isoform 1 of IL-31Rα, were stimulated with 30 ng/ml rhIL-31 for 15 min. STAT3 phosphorylation (p-STAT3) was detected by Western blotting. To control for equal loading, total STAT3 protein was measured. B, luciferase reporter gene assay. HeLa, HEK293, and Hep3B cells were transiently transfected with a STAT3 luciferase reporter and expression plasmids encoding either isoform 1 or 3 of IL-31Rα. As a control, the empty vector (pCDH) was used. Additionally, OSMRβ or empty vector (−OSMRβ) was co-transfected. 24 h post-transfection, cells were stimulated with 30 ng/ml rhIL-31. Empty bars show the unstimulated samples (ui), and black bars indicate IL-31-induced samples. Data represent mean values of three independent experiments carried out in duplicate. Error bars indicate standard deviations. C, Western blot showing expression of the IL-31 receptor chains. HeLa, HEK293, and Hep3B cells were transiently transfected with expression plasmids encoding either isoform 1 or 3 of IL-31Rα with an N-terminal His tag. As a control, the empty vector (pcDNA-His) was used. Additionally, FLAG-tagged OSMRβ (+OSMR β) or the empty pCMV-FLAG vector (−OSMRβ) was co-transfected. 48 h post-transfection, cells were lysed and expression of IL-31Rα and OSMRβ was monitored by Western blotting. D, IL-31-induced STAT3 activation in HEK293 cells expressing OSMRβ mutants. Cells were transfected with a STAT3 reporter, IL-31Rα isoforms 3, 1, or the empty vector control (pCDH) in combination with wild-type (WT) or mutated versions of human OSMRβ. Filled bars represent IL-31-treated samples, and empty bars represent the corresponding un-induced samples. Data represent mean values of five independent experiments carried out in duplicate. The expression efficiency of the IL-31Rα isoforms and all variants of OSMRβ was examined by Western blot detection of His- and FLAG-tagged proteins, respectively (E). Error bars indicate standard deviations. ANOVA, Tukey's multiple comparison test: **, p ≤0.01; ***, p ≤0.001.

