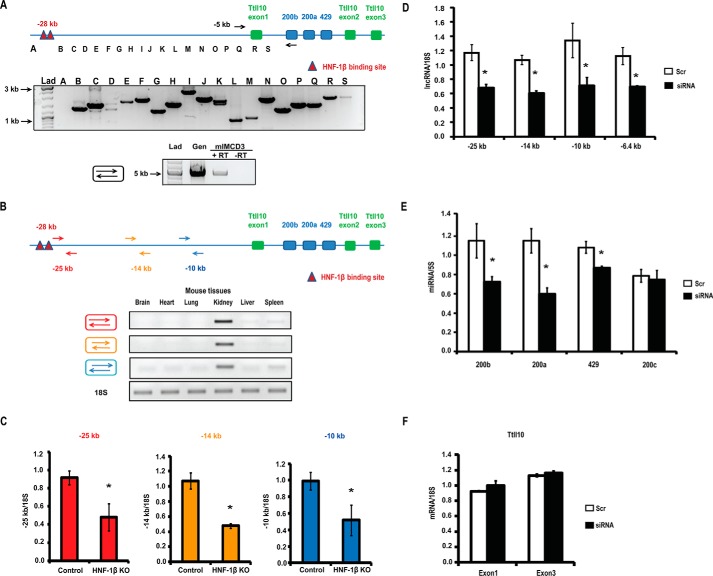
FIGURE 5.
HNF-1β regulates expression of a long noncoding RNA containing the miR-200 cluster. A, upper panel, RT-PCR analysis of mouse kidney RNA using overlapping PCR primer sets (B–S) designed to amplify the region between the HNF-1β binding sites and miR-200b. The “A” primer set was designed to amplify a region 2-kb upstream to the HNF-1β binding sites. Products were analyzed on a 1% agarose gel and stained with ethidium bromide. PCR products ranging in size from 0.8 to 2.4 kb were obtained from all primer sets except A. Lower panel, RT-PCR analysis of mIMCD3 cells using a forward primer upstream of the Ttll10 promoter and a reverse primer within the miR-200b locus. A 4.7-kb product was detected in RNA from mIMCD3 cells but was not detected in the absence of reverse transcriptase (RT). Amplification of genomic DNA (Gen) was used as a positive control. Lad, size ladder. B, RT-PCR analysis of RNA from various mouse tissues using primers (arrows) designed to amplify regions located 10, 14, and 25 kb upstream to the miR-200 cluster. The RT-PCR products were analyzed on a 1% agarose gel stained with ethidium bromide. The lower panel shows amplification of 18S rRNA. C, Q-PCR analysis showing levels of the lncRNA in kidneys from KspCre;HNF-1βfl/fl (HNF-1β KO) mice and wild-type littermates (control). Colored bars correspond to the regions of the lncRNA shown in B. The kidneys were analyzed at postnatal day 28, n = 3. D, Q-PCR analysis showing levels of the lncRNA in mIMCD3 cells transfected with a mixture of four siRNAs targeting the lncRNA (solid bars) or scrambled (Scr) siRNA as a control (open bars). Primer pairs amplified the indicated regions of the lncRNA. E, Q-PCR analysis showing levels of miR-200b, miR-200a, miR-429, and miR-200c in mIMCD3 cells after transfection with siRNA against the lncRNA (solid bars) or scrambled siRNA (open bars). F, expression of mouse Ttll10 (exon 1 and exon 3) in mIMCD3 cells transfected with siRNA against the lncRNA (solid bars) or control scrambled siRNA (open bars). Data shown represent the mean of three independent experiments. Error bars indicate S.E. * indicates p < 0.05.

