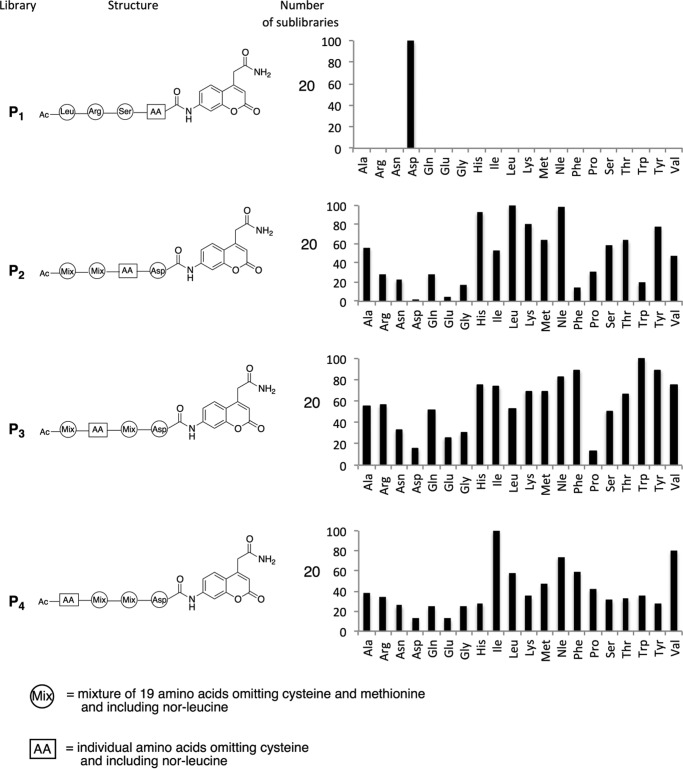
FIGURE 2.
Phytaspase substrate specificity based on peptide library screenings using P4-P1 libraries. Structures of the peptide libraries containing the ACC reporter group are depicted schematically on the left. Right, results of proteolytic activity measurements. The x axes represent the amino acids depicted using the three-letter code. The y axes represent relative enzymatic activity. The highest activity in each assay was set as 100%; all other activities are shown relative to this. All assays were repeated at least three times.

