FIGURE 7.

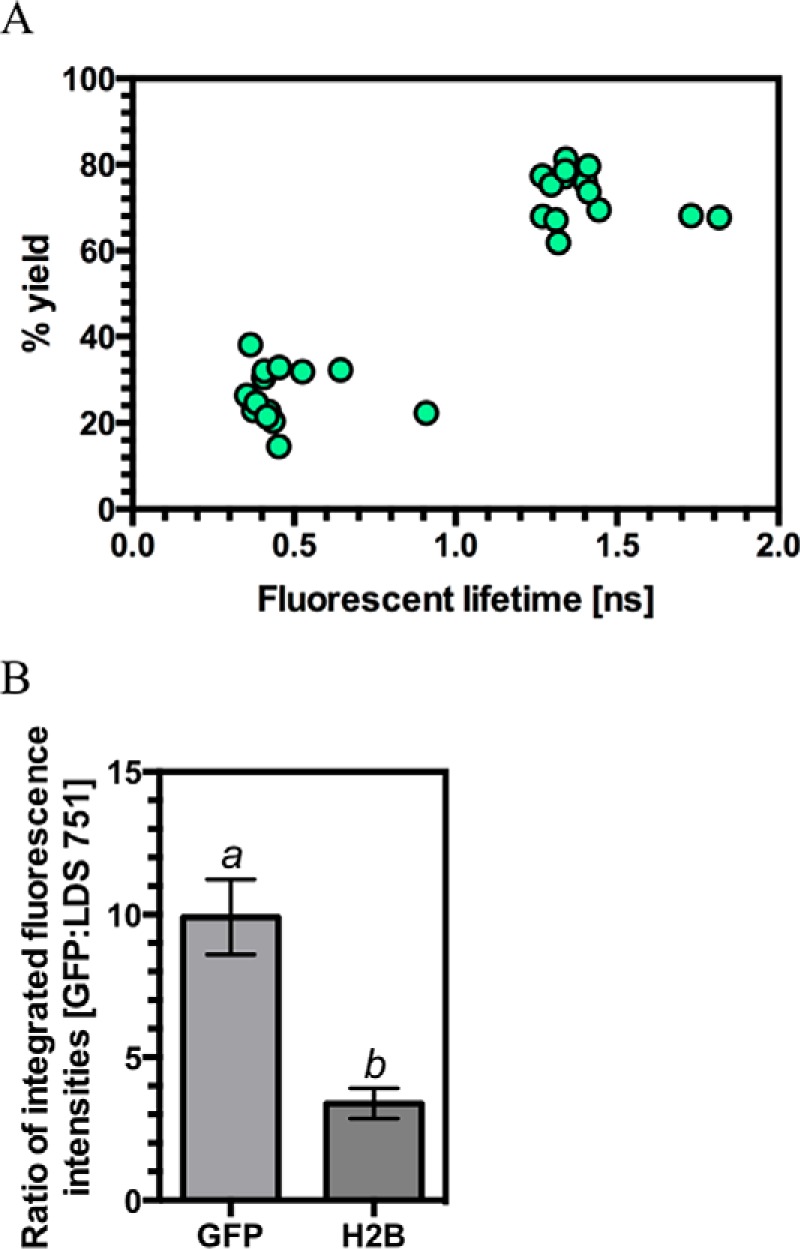
Individual fluorescent lifetime signals for GFP can be resolved from agroinfiltrated plants. A, plot of the identified fluorescent lifetimes for GFP from agroinfiltrated N. benthamiana epithelial cell nuclei against the percentage yield for that lifetime. The graph represents 14 measurements from seven independently infiltrated leaves with each measurement providing two fluorescent lifetime values. B, ratios for the integrated emission intensities for GFP and LDS 751 in GFP (negative control) and H2B-GFP (positive control) agroinfiltrated N. benthamiana (n = 6–7; bars with different letters are significantly different (p < 0.05); Student's t test). Error bars, S.E.
