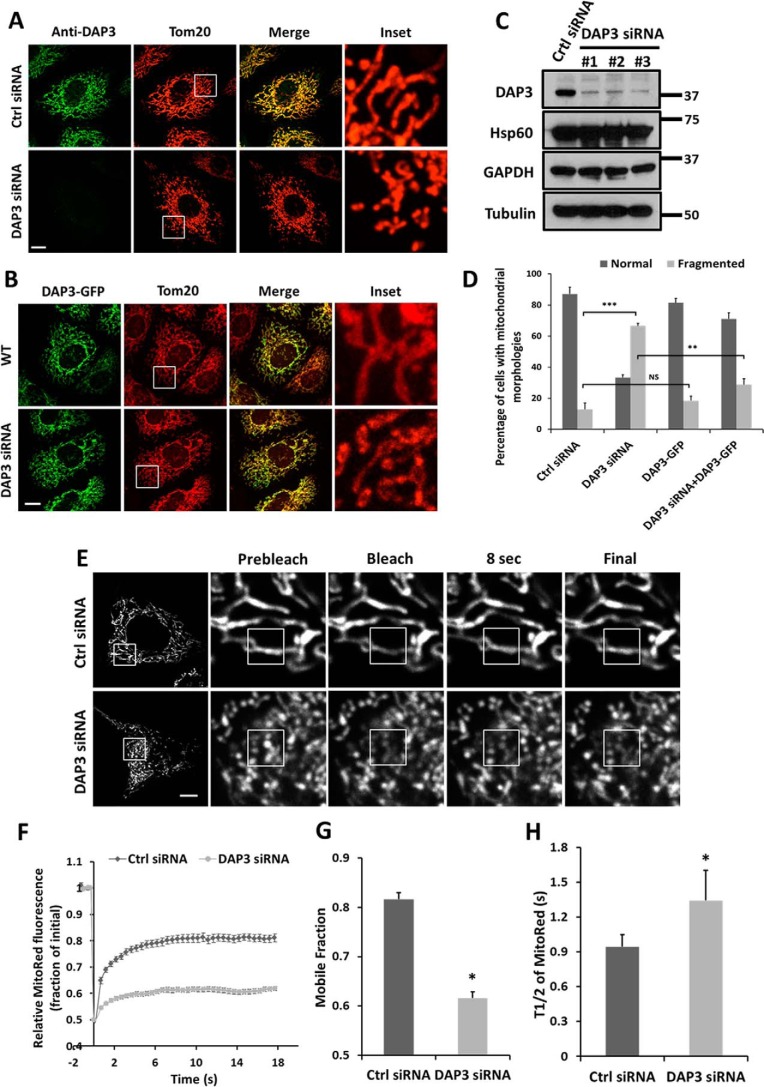
FIGURE 2.
Depletion of DAP3 results in mitochondrial fragmentation. A, HeLa cells transfected with control or DAP3-siRNA were stained with Tom20 (red) and DAP3 (green) antibodies. Scale bar, 10 μm. B, wild-type (WT) and DAP3-siRNA treated HeLa cells were transfected with DAP3-GFP and immunostained with Tom20. Scale bar, 10 μm. C, whole cell lysates of HeLa cells treated with control- or DAP3-siRNA for 48 h were collected and subjected to SDS-PAGE. The knockdown levels of DAP3 were detected using an anti-DAP3 antibody. D, the bar chart represents the percentage of different types of mitochondrial morphology of cells as treated in A and B (n = 100 cells quantified from three independent experiments). Statistical significance was calculated using Student's t test. **, p < 0.01; ***, p < 0.001; NS indicates not significant (p > 0.05). Error bars represent mean ± S.D. E, HeLa cells stably expressing mito-RFP treated as indicated were applied to FRAP analysis. The images were acquired in 0.5-s intervals. A 2 × 2-μm2 square region of interest (ROI) was placed on the mitochondrial fiber and photobleached with a 561-nm laser. Scale bar, 10 μm. F, normalized recovery curves of FRAP assay in E. The data were collected from 30 ROIs in 20 cells in 3 independent experiments. Error bars represent mean ± S.E. G and H, bar charts represent the mobile fraction and the recovery half-life (t½) of mito-RFP fluorescent signal in the photobleached area. Statistical significance was calculated using Student's t test. *, p < 0.05. Error bars represent mean ± S.E.

