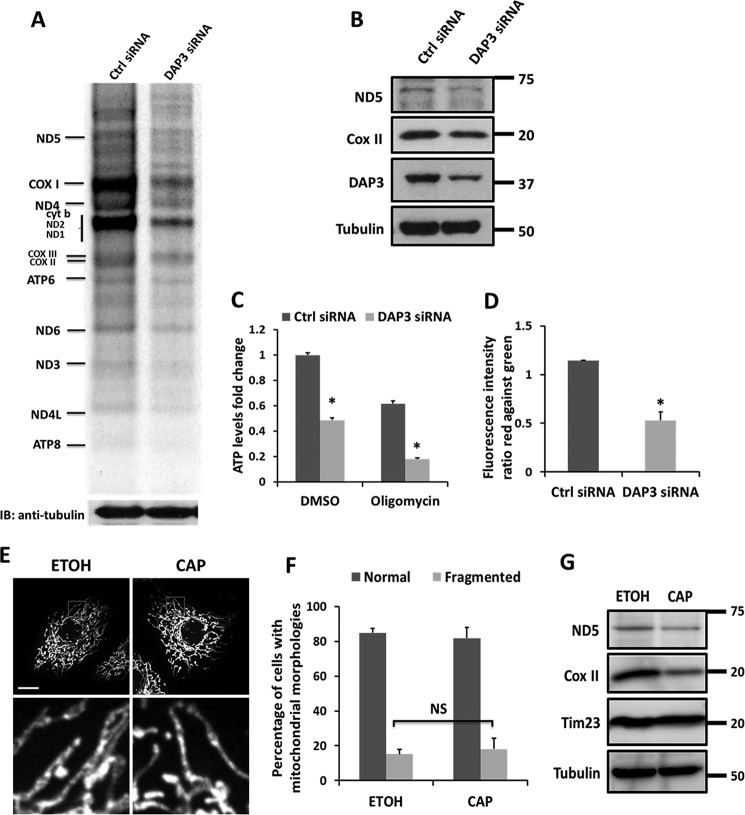
FIGURE 3.
Knockdown of DAP3 impairs mitochondrial function. A, pulse labeling mitochondrial translation assay for control- or DAP3-siRNA-transfected HeLa cells by AHA. B, steady-state levels of mitochondrial respiratory components from the mitochondrial translation products were subjected to SDS-PAGE and immunoblotted (IB) with antibodies against ND5, COX II, DAP3, and Tubulin, respectively. C, HeLa cells were transfected with control- or DAP3-siRNA for 48 h. Immediately, the cells were treated with DMSO or 10 μg/ml of oligomycin for 3 h, respectively. ATP levels were measured by luciferin-luciferase bioluminescence assay. The bar chart represents the fold-changes in normalized ATP values to the control cells. Each treatment was measured in triplicates. Statistical significance was calculated using Student's t test. *, p < 0.05. Error bars represent mean ± S.D. D, quantitative analysis of the ΔΨm using JC-1 dye in control- or DAP3-siRNA transfected HeLa cells was performed using FACS by three independent experiments. Statistical significance was calculated using Student's t test. *, p < 0.05. Error bars represent mean ± S.E. E, HeLa cells were treated with vehicle (EtOh, ethanol) or chloramphenicol for 48 h. Immediately, cells were fixed and immunostained by Tom20 antibody. The insets show enlarged views of the boxed regions. Scale bar, 10 μm. F, the bar chart represents the percentage of different types of mitochondrial morphology of cells as treated in E (n = 100 cells quantified from three independent experiments). Statistical significance was calculated using Student's t test. NS indicated not significant (p > 0.05). Error bars represent mean ± S.D. Scale bar, 10 μm. G, whole cell lysates of HeLa cells treated as in E were collected and subjected to immunoblotting using indicated antibodies.

