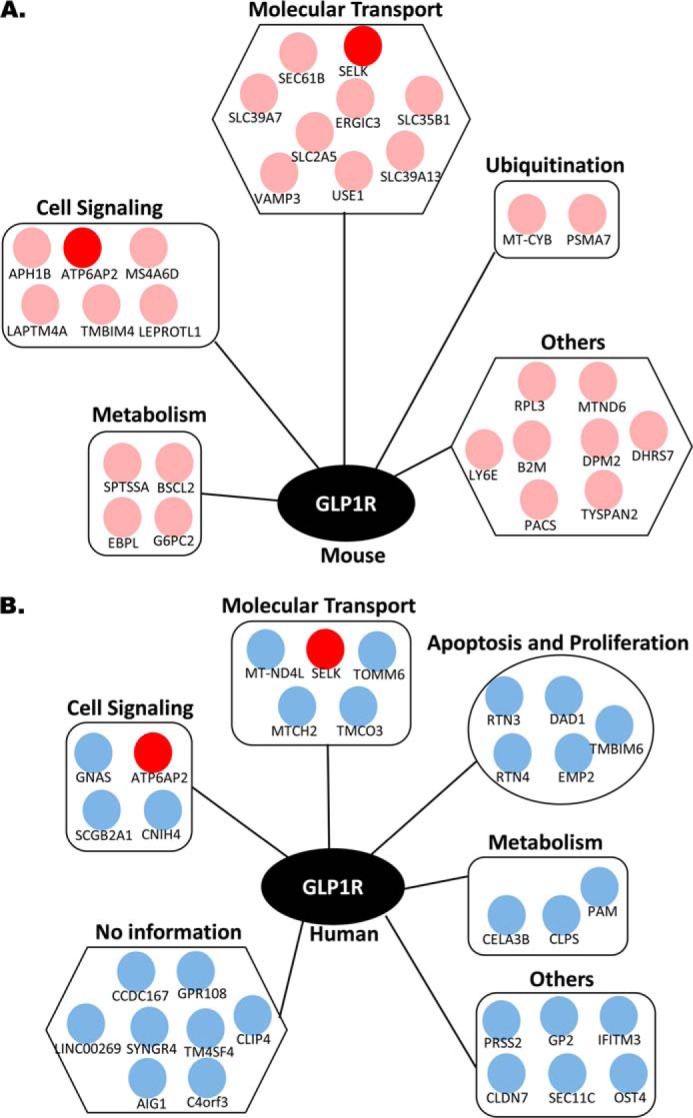
FIGURE 2.

Interactor networks of GLP1R identified from human and mouse islet MYTH screens. A and B, mouse islet (A) and human islet (B) cDNA libraries. Each interactor is represented by a separate dot. Pink dots represent interactors identified in mouse islets, and blue dots represent interactors identified in human islets. Interactors common to both mouse and human islets are identified in red.
