
FIGURE 3.
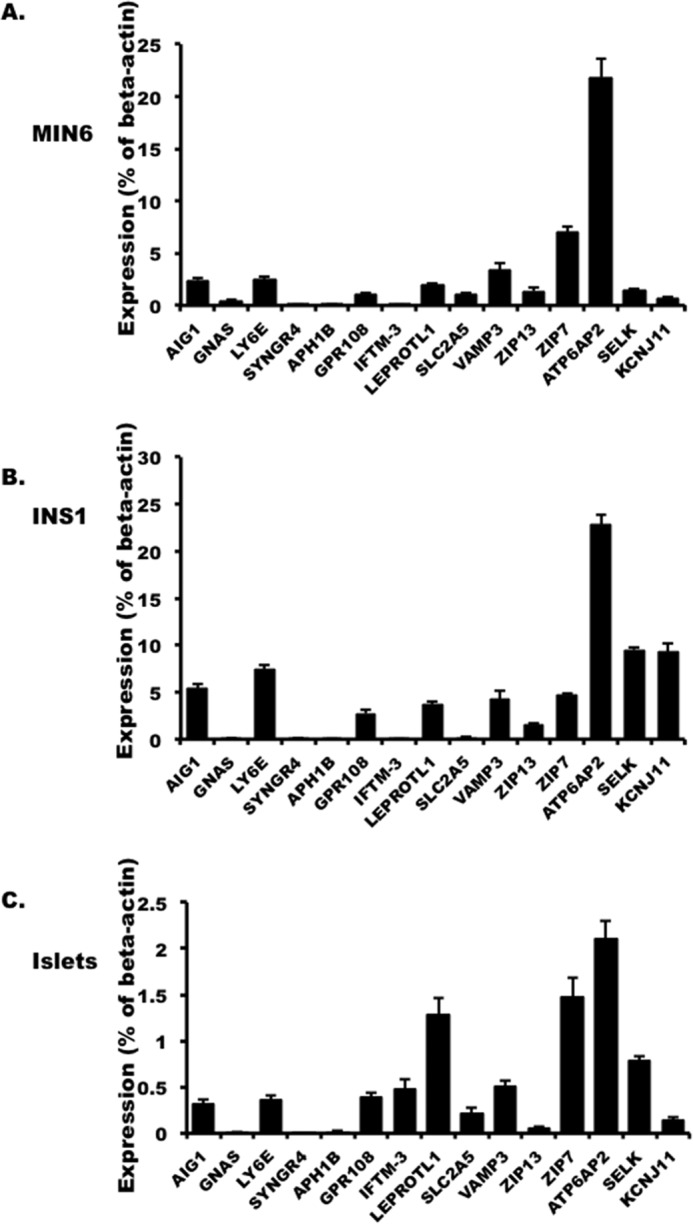
The expression of selected interactors in MIN6 (A), INS1 832/3 cells (B), and mouse islets (C) presented as the percentage of β-actin in the cell. The values are represented by the averages ± S.E. from triplicates in three independent experiments.