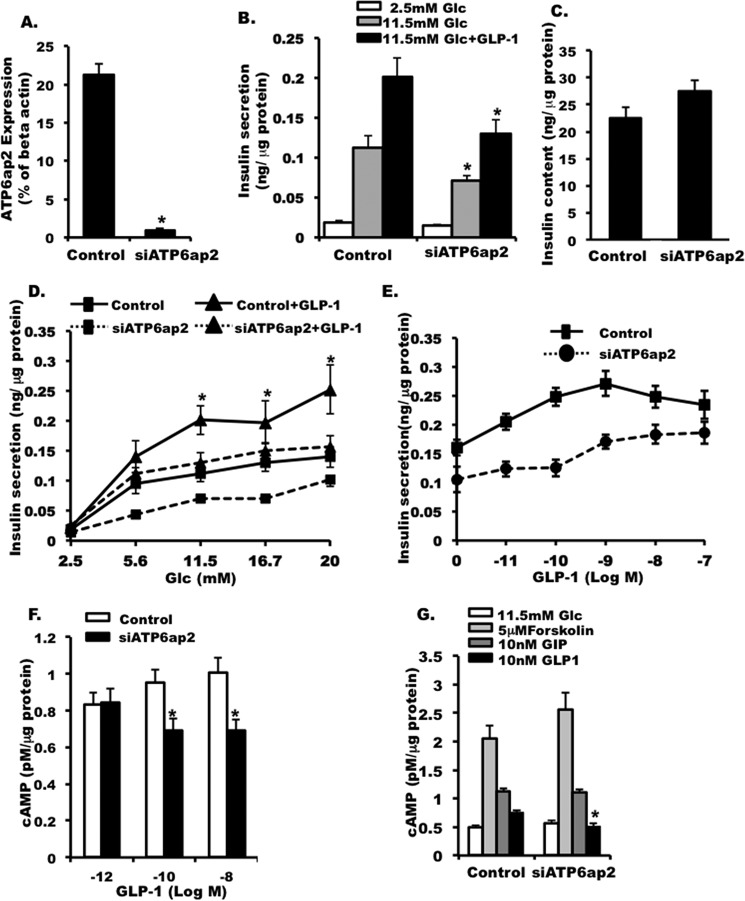
FIGURE 7.
Effect of ATP6ap2 in INS-1 cells. A, qPCR showing the efficiency of siATP6ap2 in knocking down ATP6ap2 in INS-1 cells. B, effect of ATP6ap2 knockdown on insulin secretion in INS-1 cells. C, insulin content in INS-1 cells transfected with siATP6ap2. D, insulin secretion in INS-1 cells transfected with scrambled siRNA (Control) and siATP6ap2 at different glucose concentration. E, insulin secretion in cells transfected with siATP6ap2 at 11.5 mm glucose in the presence of incremental doses of GLP1. F, cAMP accumulation in INS-1 cells transfected with siATP6ap2 at different doses of GLP1. G, cAMP accumulation in siATP6ap2 transfected cells that were treated with forskolin, GIP, and GLP1, respectively. The values are represented by the averages ± S.E. from triplicates in at least three independent experiments. *, p < 0.05 (n = 4–6).

