FIGURE 8.
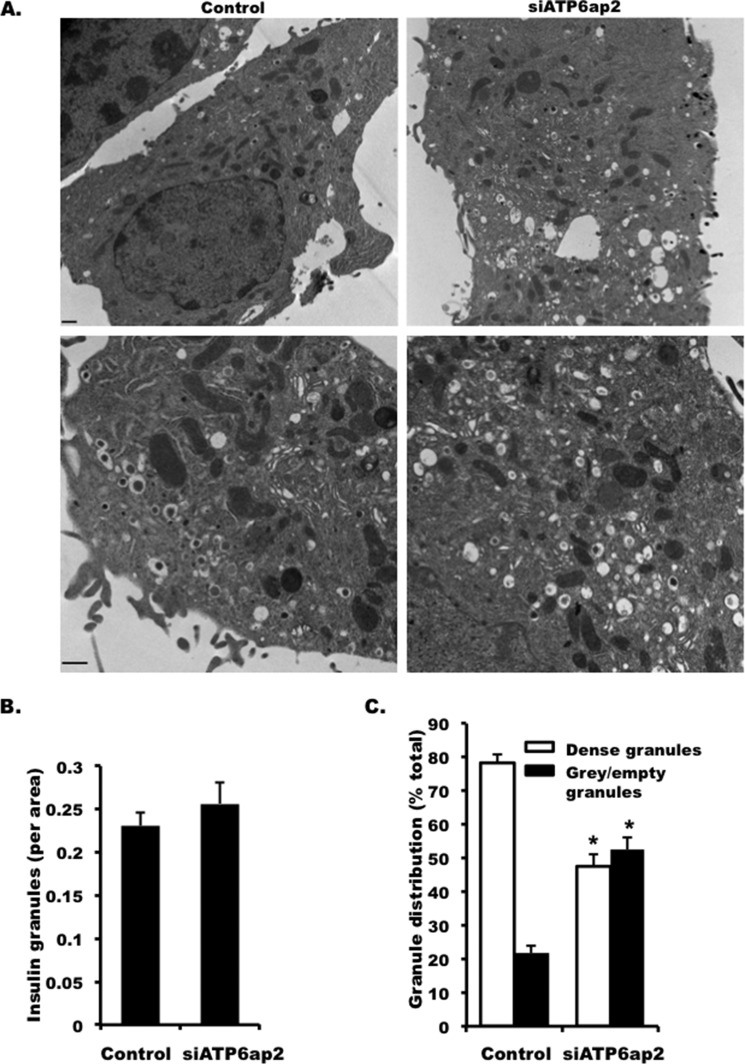
Effect of knocking down ATP6ap2 on insulin granules. A, representative images of electron microscopy showing insulin granules in INS-1 cells transfected with siATP6ap2. The lower panel is shown in higher magnification. Bar, 500 nm. B, granule numbers in INS-1 cells transfected with siATP6ap2. C, percentages of dense (mature) and gray/empty (immature) granules in INS-1 cells transfected with siATP6ap2. Representative images are from at least three independent experiments. *, p < 0.05 (n = 3–5).

