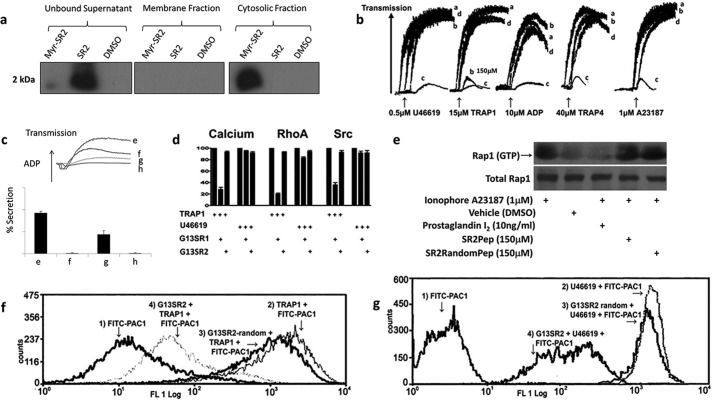
FIGURE 1.
Effects of G13SR1pep and G13SR2pep on human platelet function. a, myristoylated or non-myristoylated peptide were incubated with platelet PRP, which was then separated into unbound, membrane bound, or cytosolic fractions. An antibody raised against G13SR2 sequence was used for immunoblotting. ImageJ densiometric analysis indicates that roughly 5% of the myristoylated peptide remains unbound in the supernatant and that 95% partitions to the cytosolic fraction. b, traces denoted as a are representative of PRP pretreated with either 500 μm G13SR1random pep or G13SR2random pep. Unless otherwise specified in the figure; traces b, c, and d are representative of PRP pre-treated with 500 μm G13SR1pep, 150 μm G13SR2pep, or 150 μm G13SR2mutant pep, respectively. From left to right, the agonists used to induce platelet aggregation are U46619, TRAP1, ADP, TRAP4, and A23187. c, shows the effects of G13SR2pep and aspirin (ASA) on ADP-induced (3 μm) platelet aggregation (top panel) and secretion (bottom panel) in human PRP. Traces and bars e–h represent PRP preincubated with 75 μm G13SR2random pep, 1.0 mm ASA, 75 μm G13SR2pep, and 75 μm G13SR2pep plus 1.0 mm ASA, respectively. d, illustrates the effects of 500 μm G13SR1pep and 500 μm G13SR2pep on calcium, RhoA, and Src activation induced by 15 μm TRAP1 or 0.5 μm U46619. The agonist-mediated calcium, RhoA and Src responses in the absence of peptide have been standardized to 100%. e shows the activation state of Rap1 when treated with 1.0 μm A23187, vehicle (DMSO), or 1.0 μm A23187 with either 10 ng/ml PGI2, 150 μm G13SR2pep, or 150 μm G13SR2random pep. The top panel depicts Rap1 (GTP) pulled down by recombinant RalGDS from human platelet PRP, while the lower panel depicts total Rap1 present in the platelet lysate, each probed with an anti-Rap1 antibody. f and g show the effects of G13SR2pep on human platelet αllbβ3 integrin activation as measured by FITC-PAC-1 antibody labeling. Panel f trace 1 depicts resting platelets. Trace 2 represents platelets stimulated with 15 μm TRAP1. Trace 3 represents platelets pretreated with 500 μm G13SR2random pep, followed by 15 μm TRAP1 stimulation. Trace 4 represents platelets pretreated with 150 μm of G13SR2pep, followed by 15 μm TRAP1 stimulation. In panel g, trace 1 depicts resting platelets. Trace 2 represents platelets stimulated with 0.5 μm U46619. Trace 3 represents platelets pretreated with 500 μm G13SR2random pep, followed by 0.5 μm U46619 stimulation. Trace 4 represents platelets pretreated with 150 μm of G13SR2pep, followed by 0.5 μm U46619 stimulation. All results are representative of data obtained using at least three separate units of human PRP, and representative data were chosen for each figure.

