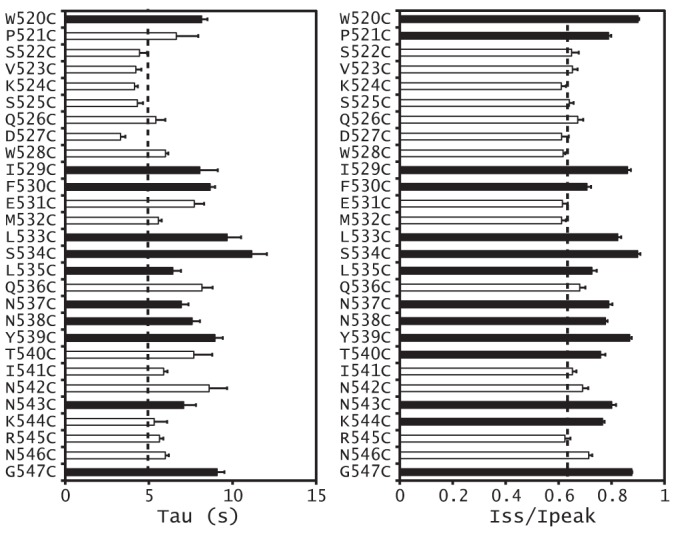
FIGURE 7.

Magnitude and time constant of the Na+ self-inhibition response of α subunit knuckle domain mutants. The Iss/Ipeak (right) and τ (left) values were obtained as described under “Experimental Procedures.” Values that are significantly different from that of WT in the same batch of oocytes are shown as black bars (p < 0.01, n = 4–7). Dashed lines, averaged WT values from all tested oocytes. Error bars, S.E.
