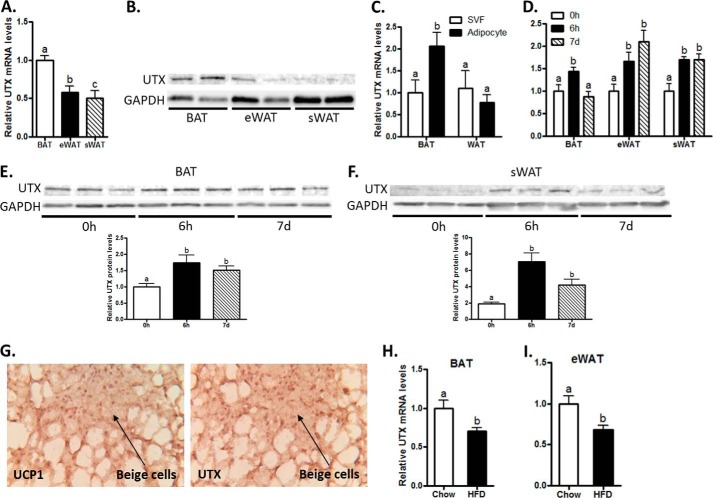
FIGURE 2.
UTX expression is induced by cold exposure in BAT. BAT exhibits higher UTX mRNA (A) and protein (B) levels than WAT. C, UTX mRNA levels are higher in brown adipocytes than in stromal vascular fractions (SVFs), while there is no differential expression in adipocytes and SVFs of WAT. D, UTX mRNA levels were induced by cold exposure in BAT and WAT of mice. E and F, UTX protein levels were induced by cold exposure in BAT and WAT of mice. G, UTX protein is induced in beige cells of WAT. H and I, UTX mRNA expression in BAT (D) and WAT (E) are down-regulated by high fat diet feeding (12 weeks). UTX mRNA and protein levels were measured by quantitative RT-PCR and immunoblotting, respectively, as described under “Experimental Procedures.” Immunohistochemical staining of UCP1 and UTX protein were conducted in two continuous serial sections of WAT from mice exposed to cold at 4 °C for 7 days. All data are expressed as mean ± S.E., n = 4; groups labeled with different letters are statistically different from each other. eWAT: epididymal WAT; sWAT: subcutaneous WAT.

