. 2015 Sep 7;4:e08758. doi: 10.7554/eLife.08758

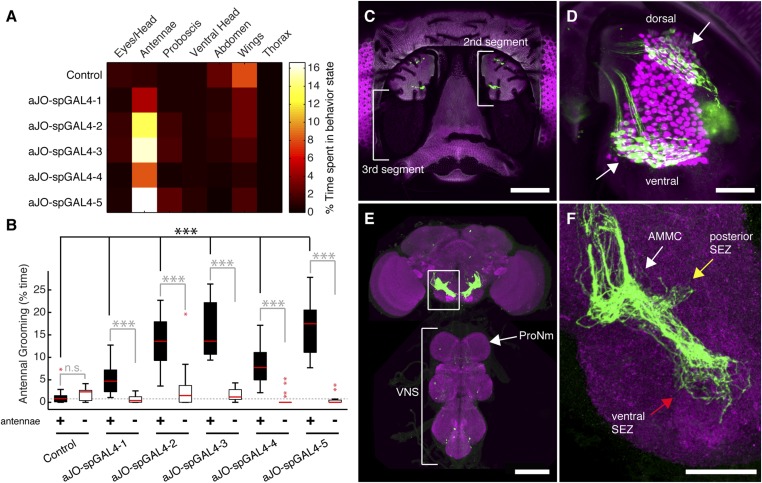
Figure 1. Sensory neurons that elicit antennal grooming.

(A) Grooming movements performed by flies in which aJO spGAL4 pairs drove expression of thermally activated dTrpA1. Movements were manually scored from 2 min of recorded video per fly (n ≥ 17 flies per spGAL4). Colors correspond to the percent of total time spent performing each movement. (B) Percent time flies spent antennal grooming with thermogenetic activation of neurons targeted by spGAL4 pairs, with or without their antennae (filled or open boxes, respectively). Bottom and top of the boxes indicate the first and third quartiles respectively; median is the red line; whiskers show the upper and lower 1.5 IQR; red dots are data outliers (n ≥ 17 for each box; asterisks show p < 0.0001, Kruskal–Wallis and post hoc Mann–Whitney U pairwise tests with Bonferroni correction). Dotted line marks the median of the intact control. (CF) aJO-spGAL4-1 driving expression of green fluorescent protein (GFP). Maximum intensity projections are shown. (C) Frontal view of the head (native GFP fluorescence, green; cuticle autofluorescence, magenta). Left bracket shows the third antennal segment. Right bracket marks the second antennal segment, which is shown in (D). Scale bar, 100 μm. (D) Second antennal segment co-stained with anti-GFP (green) and anti-Elav (magenta, marks neuronal nuclei) antibodies. White arrows show the ventral and dorsal aJO clusters. Scale bar, 25 μm. (E, F) Central nervous system (CNS) co-stained with anti-GFP (green) and anti-Bruchpilot (magenta) to visualize the aJO afferent projections into the ventral brain neuropile (E) and their specific targeting of the indicated antennal mechanosensory and motor center (AMMC) and subesophageal zone (SEZ) regions (arrows shown in F). Box in (E) indicates region shown in F. Scale bars, (E) 100 μm and (F) 25 μm. Prothoracic neuromeres (ProNm). Ventral nervous system (VNS). See also Figure 1—figure supplement 1 and Figure 1—figure supplement 2.

DOI: http://dx.doi.org/10.7554/eLife.08758.003

Figure 1.

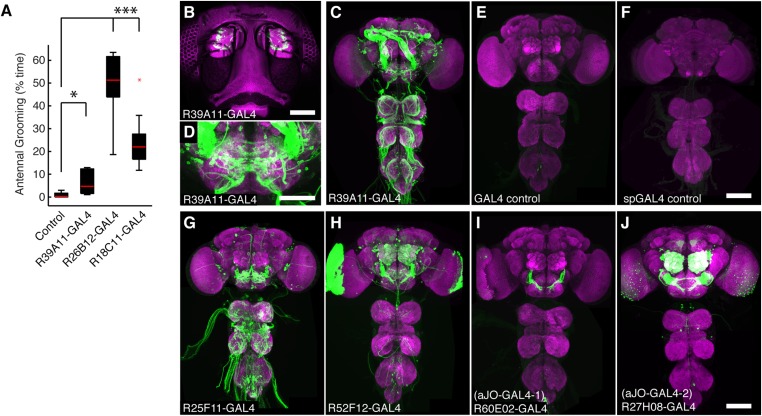
Figure 1—figure supplement 1. GAL4 lines that target expression to sensory neurons from the antennae and elicit grooming.

Figure 1—figure supplement 1.

(A) Percent of total time three GAL4 lines expressing dTrpA1 spent antennal grooming, compared with controls. Box plots, statistics, and experimental conditions are as described in Figure 1A,B (n ≥ 10, asterisks represent: ***p < 0.001, *p < 0.01). R26B12-GAL4 and R18C11-GAL4 expression patterns are shown in Figure 2—figure supplement 1B,C. (B) Head GFP expression pattern of R39A11-GAL4 (native GFP fluorescence shown, green). The cuticular autofluorescence is shown in magenta. Scale bar, 100 μm. (C, D) Expression in (C) the CNS and (D) SEZ of R39A11-GAL4. Brains were co-stained with anti-GFP (green) and anti-bruchpilot (magenta). Scale bar, (D) 50 μm. (E, F) CNS images of control lines used in this study: (E) GAL4 and (F) spGAL4 controls do not show significant expression. Scale bars, 100 μm. (G, J) GFP expression patterns of the CNS of GAL4 lines that had expression in sensory neurons projecting from the antennae and displayed increased antennal grooming with dTrpA1. (G) R25F11-GAL4, (H) R52F12-GAL4, (I) R60E02-GAL4 (aJO-GAL4-1) and (J) R27H08-GAL4 (aJO-GAL4-2).
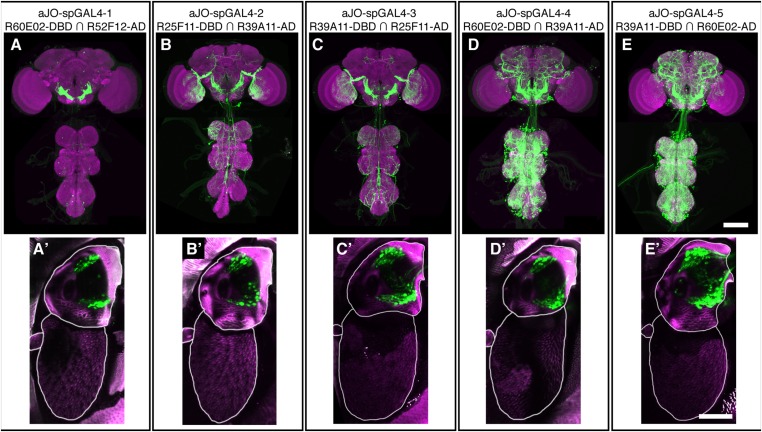
Figure 1—figure supplement 2. spGAL4 pairs that target expression to sensory neurons in the antennae and elicit grooming.

Figure 1—figure supplement 2.

(AE) CNS expression patterns of spGAL4 line pairs that displayed increased antennal grooming with dTrpA1. (A′E′) Native GFP expression (green) in the antennae of corresponding spGAL4 lines shown in AE. The cuticular autofluorescence is shown in magenta. Scale bars, 50 μm.
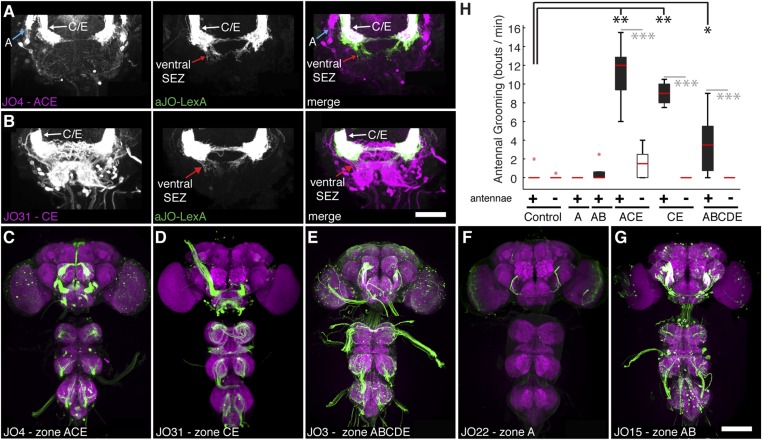
Figure 1—figure supplement 3. JO neurons projecting to zone C/E elicit antennal grooming.

Figure 1—figure supplement 3.

(A, B) Co-expression of JO sensory neurons using aJO-LexA to express GFP (green) and (A) JO4-GAL4 or (B) JO31-GAL4 lines to express tdTomato (magenta). See Figure 4—figure supplement 1 for more details about aJO-LexA. aJO-LexA neurons have distinct projections in the ventral SEZ (middle and right panel, red arrows), but show overlapping arborizations with zone C/E neurons in the AMMC region (right panel, white arrows) driven by JO4-GAL4. Note in A (left and right panel) that aJO-LexA does not overlap with the zone A projections (blue arrow). Scale bar, 50 μm. (CG) CNS expression patterns of JO-GAL4 lines that target different zones in the AMMC. (C) JO4-GAL4 (zones A and C/E); (D) JO31-GAL4 (zones C/E); (E) JO3-GAL4 (zones A, B, C/E, D); (F) JO22-GAL4 (zone A), and (G) JO15-GAL4 (zone A and B). Scale bar, 100 μm. (H) Number of bouts per minute of antennal grooming that each JO-GAL4 line expressing CsChrimson performed with optogenetic activation, with or without their antennae (filled or open boxes, respectively). Box plots and statistics are described in Figure 1B. (n ≥ 4 flies per JO-GAL4, asterisks represent: *p < 0.05, **p < 0.01, ***p < 0.001.)
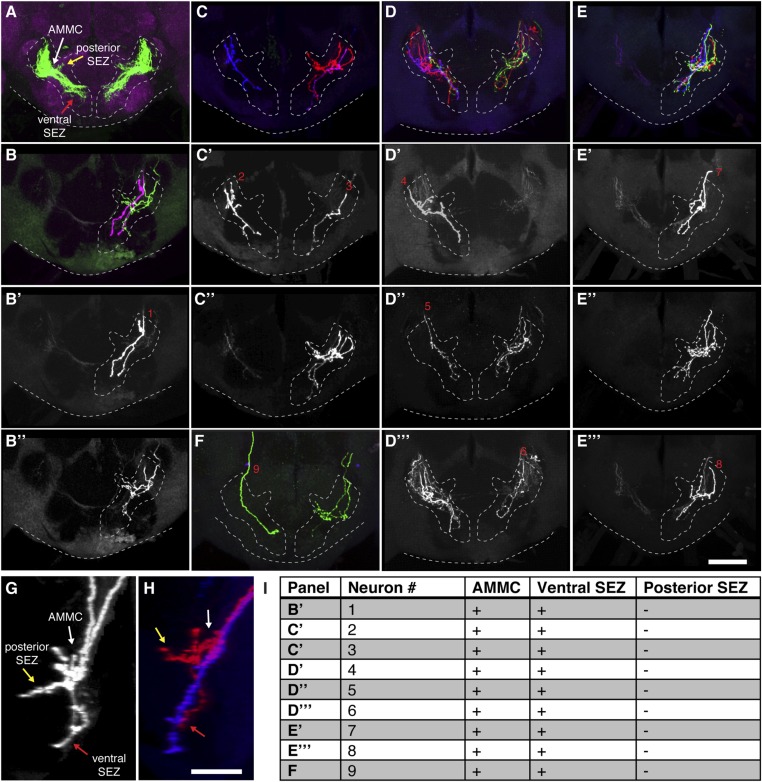
Figure 1—figure supplement 4. Most stochastically labeled aJO neurons show projections to both the AMMC and ventral SEZ.

Figure 1—figure supplement 4.

(A) Overview of the aJO neuron population with AMMC, posterior, and ventral SEZ projections (white, yellow, and red arrows point to each projection respectively). (BF) Multicolor stochastic labeling of aJO neurons in five different brains. The full patterns shown in panels B, C, D, E, F, whereas the separated channels are shown in panels B′, B′′, C′, C′′, D′D′′′, E′E′′′. Cases where single neuron clones were obtained using this method are labeled with red numbers. (G, H) Lateral view of two neurons labeled with the same color from panel B′′ in (G) and from panel C in (H) show projections to the AMMC (white arrow), ventral SEZ (red arrow) and posterior SEZ (yellow arrow). (I) Table shows the analysis of the projection branches of individual neurons corresponding with the red numbers in the figure panels. The + or − signs indicate that the neurons either do or do not project to the indicated region respectively. Scale bars, 50 μm.