. 2015 Sep 7;4:e08758. doi: 10.7554/eLife.08758

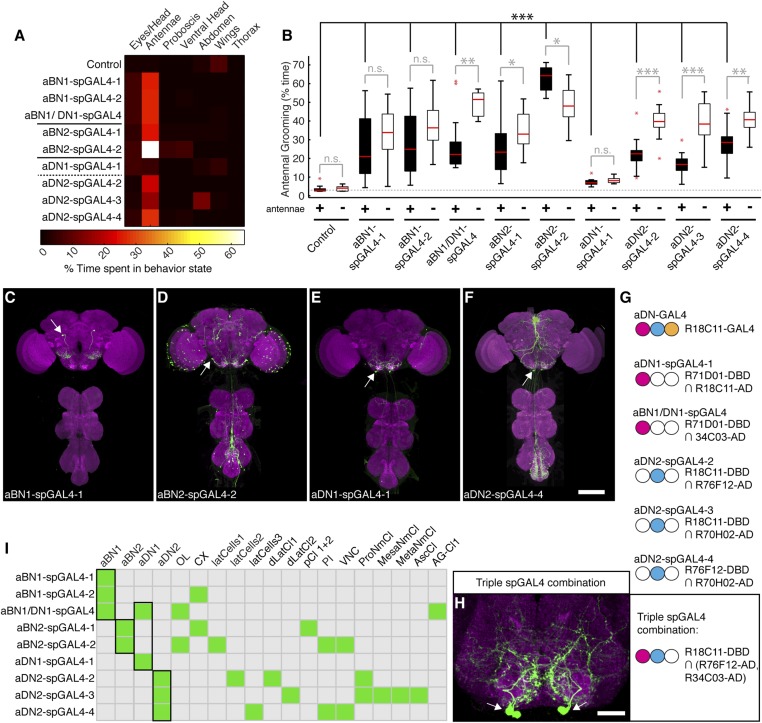
Figure 2. Interneurons that elicit antennal grooming.

(A) Grooming movements performed by interneuron spGAL4 pairs expressing thermally activated dTrpA1. Data was obtained and displayed as described in Figure 1A. (B) Percent time flies spent antennal grooming with thermogenetic activation of interneurons targeted by spGAL4 pairs, with or without their antennae (filled or open boxes respectively). Box plots and statistics are described in Figure 1B. Asterisks represent the following p values: *p < 0.01, **p < 0.001, ***p < 0.0001 (n ≥ 9 flies per spGAL4). Black p value statistics show differences between control and spGAL4 flies with their antennae. Gray statistics show differences between each spGAL4 with and without the antennae. (CF) GFP expression patterns of spGAL4 lines: (C) aBN1-spGAL4-1, (D) aBN2-spGAL4-2, (E) aDN1-spGAL4-1, (F) aDN2-spGAL4-4. Images show maximum intensity projections of co-staining with anti-GFP (green) and anti-Bruchpilot (magenta). White arrows show cell bodies. Scale bars, 100 μm. (G) antennal descending neurons (aDNs) targeted by each spGAL4 pair. Circles represent one of three neurons in aDN-GAL4. Filled circles show which neurons are targeted by each spGAL4 (enhancer pairs listed). (H) Two aDN neurons are targeted in a triple spGAL4 combination expressing GFP (white arrows). No spGAL4 combinations were identified that exclusively target aDN3. Scale bar, 25 μm. (I) Graphical summary of neuronal expression patterns of the spGAL4 pairs. Green boxes indicate expression of the pair on the left (rows) in the indicated neurons or region listed above the grid (columns). Figure 2—figure supplement 2 shows the locations of these neurons. Black framing highlights antennal grooming neurons.

DOI: http://dx.doi.org/10.7554/eLife.08758.009

Figure 2.

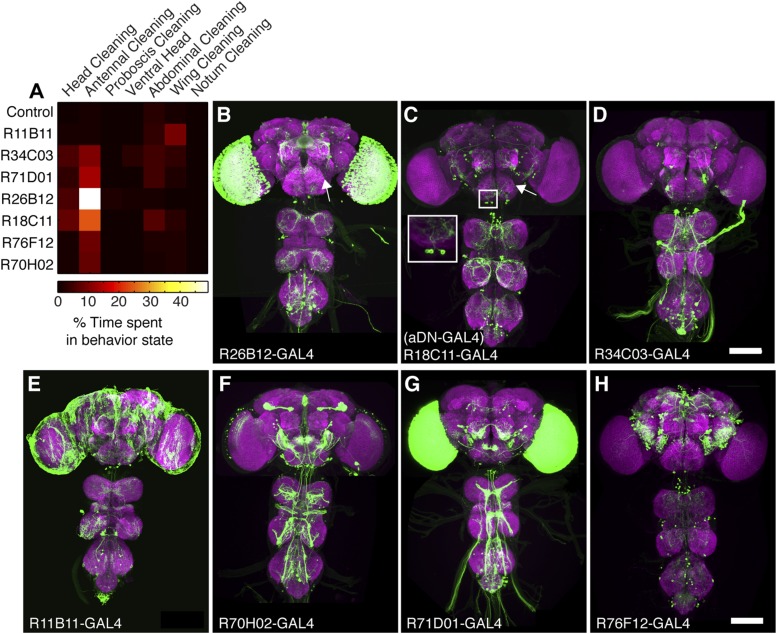
Figure 2—figure supplement 1. GAL4 lines that elicit antennal grooming.

Figure 2—figure supplement 1.

(A) Grooming movements performed by GAL4 lines expressing thermally activated dTrpA1. Data was obtained and displayed as described in Figure 1A (n = 10 per line). Note: R11B11-GAL4 did not perform significantly increased antennal grooming, however, this line was able to target antennal grooming interneurons when its enhancer was used for generating spGAL4 intersections. (BH) Images of antennal grooming GAL4 lines expressing GFP. CNSs were co-stained with anti-GFP (green) and anti-bruchpilot (magenta). (B) R26B12-GAL4, (C) R18C11-GAL4 (aDN-GAL4), (D) R34C03-GAL4, (E) R11B11-GAL4, (F) R70H02-GAL4, (G) R71D01-GAL4, and (H) R76F12-GAL4. Inset in C shows higher magnification of three candidate antennal grooming interneuron cell bodies. White arrow in (B, C) show where projections from JO sensory neurons would enter the brain if the GAL4 line targeted expression to them. Scale bars, 100 μm.
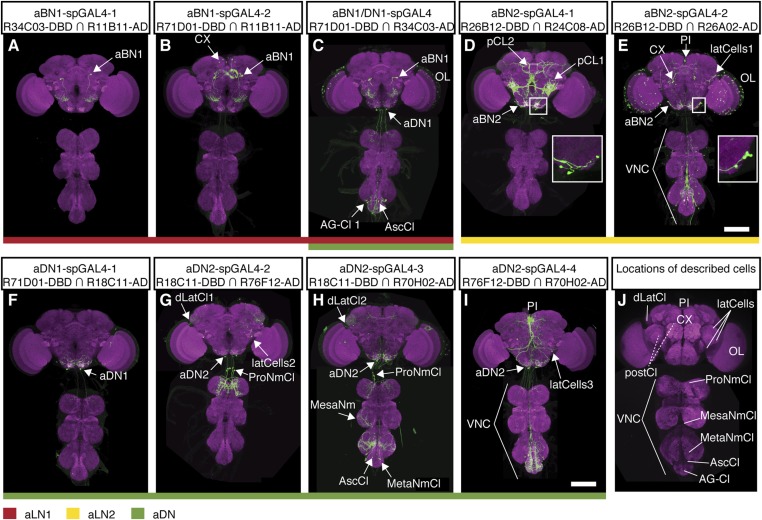
Figure 2—figure supplement 2. spGAL4 lines with interneuron expression that elicit antennal grooming.

Figure 2—figure supplement 2.

(AI) spGAL4 lines expressing GFP (green) are co-stained with anti-GFP (green) with anti-bruchpilot (magenta). The activation domains (ADs) and DNA binding domains (DBDs) used are shown below each corresponding spGAL4 pair name. Arrows or lines indicate neurons or populations of neurons targeted by each pair. Summary expression data for all spGAL4 pairs are shown in Figure 2I. (A) aBN1-spGAL4-1, (B) aBN1-spGAL4-2, (C) aBN1/aDN1-spGAL4, (D) aBN2-spGAL4-1, (E) aBN2-spGAL4-2, (F) aDN1-spGAL4-1, (G) aDN2-spGAL4-2, (H) aDN2-spGAL4-3, and (I) aDN2-spGAL4-4. Insets in D, E show aBN2 cell bodies at higher magnification; (D) shows three cell bodies and (E) shows five. Scale bars, 100 μm. (J) Summary of neuronal types targeted by interneuron spGAL4 pairs. Abbreviations: abdominal ganglion cluster (AG-Cl), ascending cluster (AscCl), metathoracic neuromere cluster (MetaNmCl), mesothoracic neuromere cluster (MesaNmCl), ProNm cluster (ProNmCl), posterior cluster (pCl 1 + 2), dorsolateral cluster (dLatCl), lateral cells (latCells), VNS, central complex (CX), optic lobes (OL), aDN, antennal local interneurons (aBN), pars intercerebralis cluster (PI). Dashed lines show neuronal population on posterior side of the brain.