. 2015 Sep 7;4:e08758. doi: 10.7554/eLife.08758

Figure 4. Functional relationships among putative antennal circuit components.

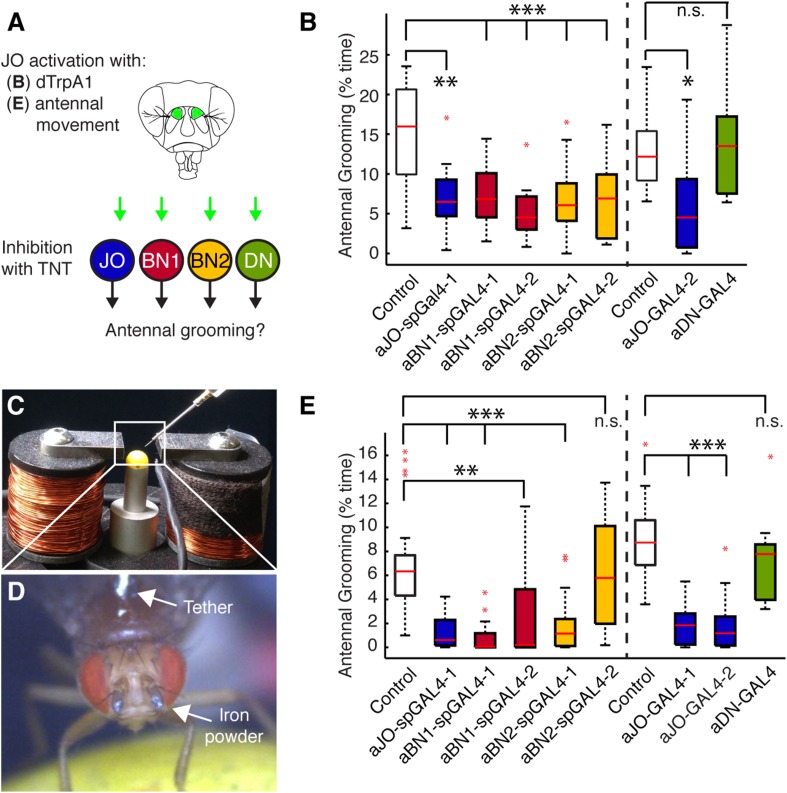
(A) Overview of experiments shown in (B, E). Grooming was induced by thermogenetic activation of Johnston's Organ (JO) neurons (dTrpA1) or by imposed displacements of the antennae. Synaptic release was blocked in different neuronal classes expressing tetanus toxin (TNT). (B) Antennal grooming performed by flies with thermogenetic activation of the aJO while inhibiting synaptic release in interneuron classes. The experiment was performed and data is displayed as described in Figure 1B (n ≥ 11 flies per spGAL4). (CE) To displace the antennae, iron powder was glued to the third antennal segment and the flies were tethered within an electromagnet. (C) Image of the electromagnet apparatus. (D) Tethered fly with iron powder on its antennae. Magnetic pulses were delivered to displace the third antennal segment at 1 Hz for 4 × 10 s periods, with 30 s rests between stimulations. Flies were recorded and their grooming movements were manually scored (see Figure 4—figure supplement 3D for ethograms). (E) The percent time that flies spent grooming their antennae within the total assay time is shown. The grooming responses to antennal movements were also tested while blocking synaptic release in the different neuronal types with TNT. Box plots and statistics are shown as described in Figure 1B (n ≥ 11 flies per line).

DOI: http://dx.doi.org/10.7554/eLife.08758.014

Figure 4.

Figure 4—figure supplement 1. aJO-, aBN2-, and aDN-LexA lines.

Figure 4—figure supplement 1.

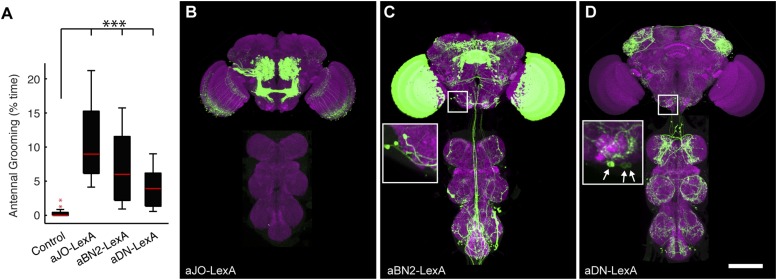
(A) Percent of total time that LexA lines expressing thermally activated dTrpA1 spent antennal grooming. Box plots, statistics, and experimental conditions are as described in Figure 1A,B (n > 10; ***p < 0.001). (BD) CNSs co-stained with anti-GFP (green) and anti-bruchpilot (magenta). LexA lines are as follows: (B) aJO-LexA, (C) aBN2-LexA, and (D) aDN-LexA. Scale bar, 100 μm. Box insets show higher magnification of cell bodies of interneurons involved in antennal grooming; (C) shows four cell bodies and (D) shows three.
Figure 4—figure supplement 2. Co-expression of LexA lines with selected spGAL4 pairs.

Figure 4—figure supplement 2.

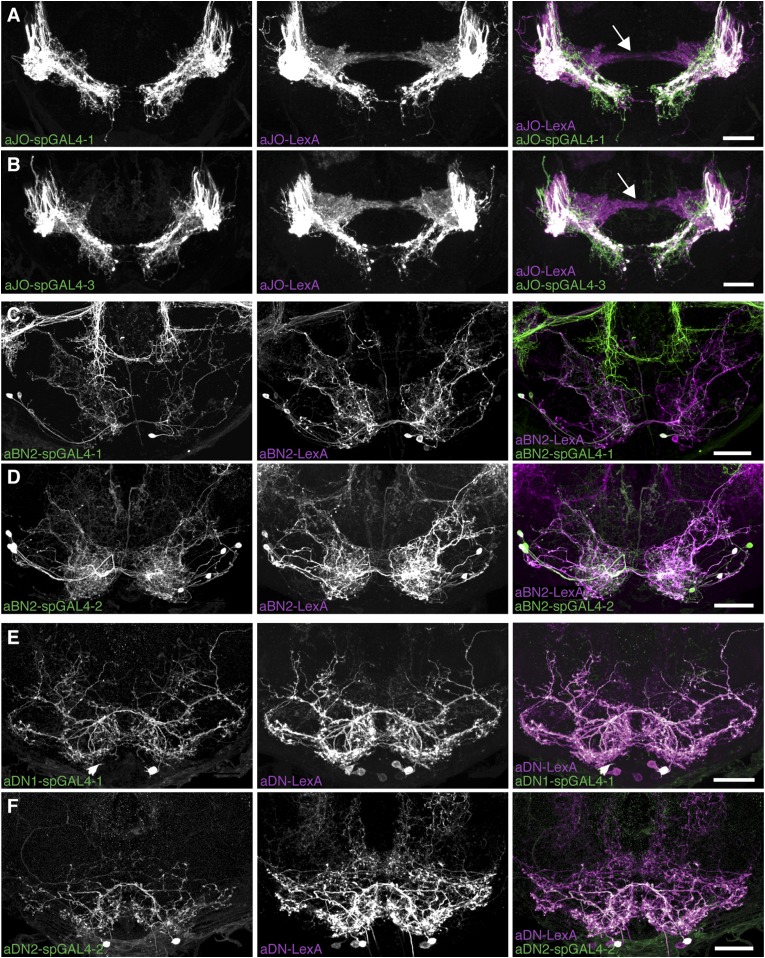
(AF) Co-expression of LexA and spGAL4 lines. Left column: spGAL4 expression patterns. Middle column: LexA expression patterns. Right column: Merged expression patterns. (A, B) Co-expression of aJO-LexA (magenta) with (A) aJO-spGAL4-1 or (B) aJO-spGAL4-3 (green). Frontal views: Arrows point to JO projections that do not co-localize with aJO projections. (C, D) aBN2-LexA (magenta) expressed with (C) aBN2-spGAL4-1 or (D) aBN2-spGAL4-2 (green). (E, F) Co-expression of aDN-LexA with (E) aDN1-spGAL4-1 or (F) aDN2-spGAL4-2. Scale bar, 25 μm.
Figure 4—figure supplement 3. Testing of stimulus parameters for the antennal displacement assay.

Figure 4—figure supplement 3.

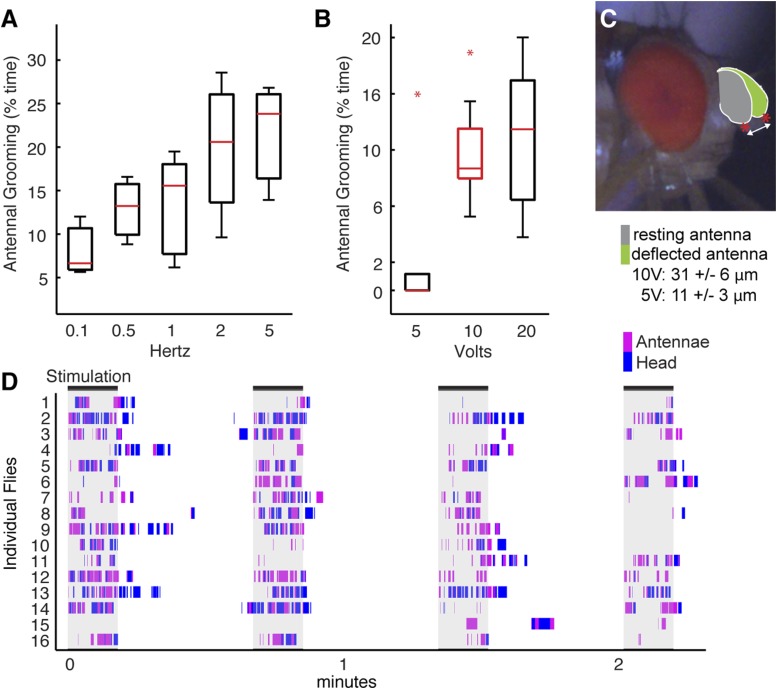
(AC) Flies were prepared as shown in Figure 4C,D (see ‘Materials and methods’) and tested for their grooming responses when different magnetic field frequencies (A) or voltages (B) were applied to displace their antennae. The grooming responses were recorded and manually scored. Plots are displayed as described in Figure 1B. (A) Box plots show the percent time that flies groomed their antennae when the magnetic field that was turned on and off at different frequencies (magnetic strength was set at 10 Volts). (B) Percent time that flies groomed their antennae when the magnetic field was applied at different voltages (frequency set at 1 Hz). Raw data used to generate the red box is shown in D. (C) Side view of a fly head showing the trajectories of the antennae before (grey) and after (green) the magnetic field was applied. Red asterisks and arrow show the measured distances. The values shown below the image represent the measured distances that the antennae moved at the indicated voltages. (D) Ethograms of grooming movements performed by 16 control flies (w1118; UAS-TeTxLC.tnt; pBPGAL4U) whose antennae were stimulated in 4 × 10 s periods by a magnetic field of 570 gauss (10 Volts) at a frequency of 1 Hz. The magnet was left off for 30 s between periods. These flies are the controls used for the experiment shown in Figure 4E.