. 2015 Sep 7;4:e08758. doi: 10.7554/eLife.08758

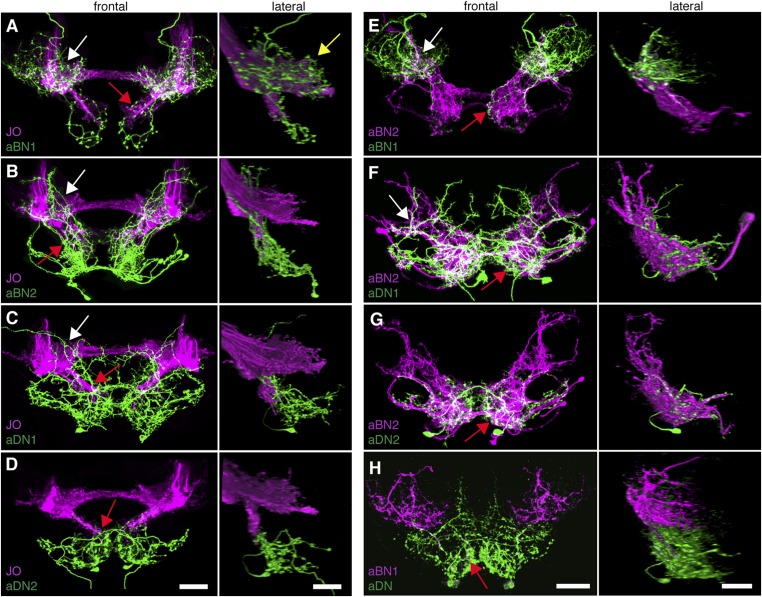
Figure 5. Antennal grooming neurons are in close proximity.

(AH) Co-expression in neuronal pairs using two binary expression systems (LexA and spGAL4) to express tdTomato or GFP in each neuronal class. Processed maximum intensity projections of frontal and lateral views are shown. See ‘Materials and methods’ about how images were processed (unprocessed images in Figure 5—figure supplement 2). Scale bars, 25 μm. (AD) Proximity between aJO-LexA targeted sensory projections (magenta) and the following interneuron spGAL4 pairs (green): (A) aBN1-spGAL4-1, (B) aBN2-spGAL4-1, (C) aDN1-spGAL4-1 and (D) aDN2-spGAL4-2. (EG) Proximity between aBN2-LexA targeted neurons (magenta) and the following interneuron spGAL4 pairs (green): (E) aBN1-spGAL4-1, (F) aDN1-spGAL4-1, (G) aDN2-spGAL4-2. (H) Proximity between aDN-LexA targeted neurons aDN (green) and aBN1-spGAL4-1 targeted neurons (magenta). Overlap between different projections of the LexA and spGAL4-targeted neurons is indicated by different colored arrows: (AC, E, F) AMMC projections white arrows, (A) posterior SEZ projection (yellow arrow), (BH) ventral SEZ projections (red arrows).

DOI: http://dx.doi.org/10.7554/eLife.08758.019

Figure 5.

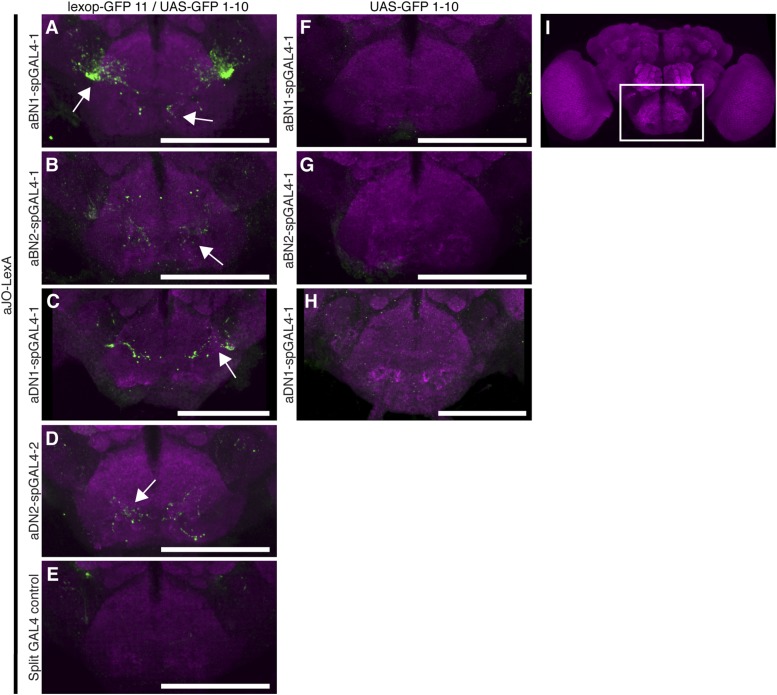
Figure 5—figure supplement 1. GFP-positive staining indicates reconstitution across synaptic partner (GRASP) staining indicates close proximity of neurons involved in antennal grooming.

Figure 5—figure supplement 1.

(AH) Expression of different GFP halves (spGFP11 and spGFP1-10) in putative connected neuronal pairs. aJO-LexA drove expression of spGFP11 in the JO neurons and spGFP1-10 expression was driven by the following spGAL4 lines: (A) aBN1-spGAL4-1, (B) aBN2-spGAL4-1, (C) aDN1-spGAL4-1, (D) aDN2-spGAL4-2, or (E) spGAL4 control. Brains were stained with an antibody that recognizes reconstituted GFP (green) (Gordon and Scott, 2009). The neuropil was stained with an anti-bruchpilot antibody (magenta). GRASP where neurons contacted each other. (FH) Controls where only GFP1-10 was expressed by: (F) aBN1-spGAL4-1 or (G) aBN2-spGAL4-1, or (H) aDN1-spGAL4-1. (I) White box marks the area shown in AH. Scale bar, 100 μm.
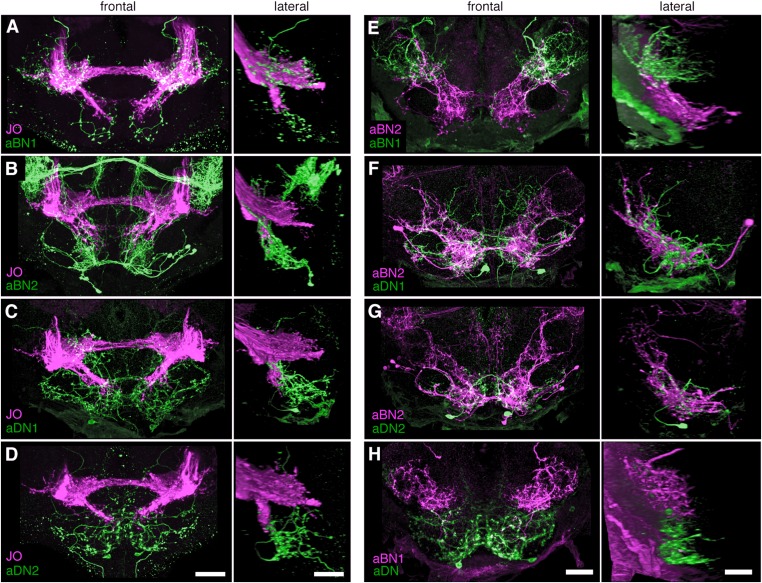
Figure 5—figure supplement 2. Co-staining indicates close proximity of neurons involved in antennal grooming.

Figure 5—figure supplement 2.

(AH) Unprocessed maximum intensity projections of co-stained images shown in Figure 5 (see ‘Materials and methods’).