. 2015 Sep 7;4:e08758. doi: 10.7554/eLife.08758

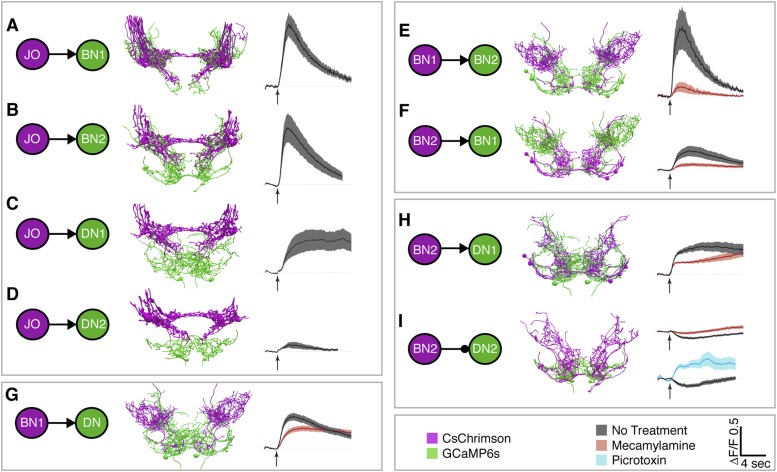
Figure 6. Different antennal grooming neurons are functionally connected.

(AI) Dissected CNSs with different neuronal classes expressing CsChrimson (magenta) were activated with red light while changes in calcium in their putative downstream partners expressing GCaMP6 (green) were imaged (ΔF/F). Each tested neuronal pair is shown using circles and as traced pairs. The direction of the connection and whether it is excitatory or inhibitory is depicted with an arrow (excitatory) or ball and stick (inhibitory). Changes in fluorescence of GCaMP6s of multiple flies under similar stimulus conditions are shown on the right (average ± s.e.m., 3–5 flies tested with 9–21 trials per trace). Arrow below each trace shows when the red light pulse was delivered. Black traces show flies that were imaged without drug treatment, whereas orange and blue traces were imaged while the nervous system was bathed with mecamylamine or picrotoxin respectively. See ‘Materials and methods’, Figure 6—figure supplement 1, Figure 6—figure supplement 2, Figure 6—figure supplement 3, and Supplementary file 2 for detailed ‘Materials and methods’, stimulus conditions, and controls. (AD) aJO-LexA tested with the following interneuron spGAL4 pairs: (A) aBN1-spGAL4-1, (B) aBN2-spGAL4-1, (C) aDN1-spGAL4-1, and (D) aDN2-spGAL4-2. (E, F) aBN2-LexA tested with aBN1-spGAL4-1. (G) aBN1-spGAL4-1 tested with aDN-LexA. (H, I) aBN2-LexA tested with either (H) aDN1-spGAL4-1 or (I) aDN2-spGAL4-2.

DOI: http://dx.doi.org/10.7554/eLife.08758.022

Figure 6.

Figure 6—figure supplement 1. Functional connectivity: controls, technical details, and raw data.

Figure 6—figure supplement 1.

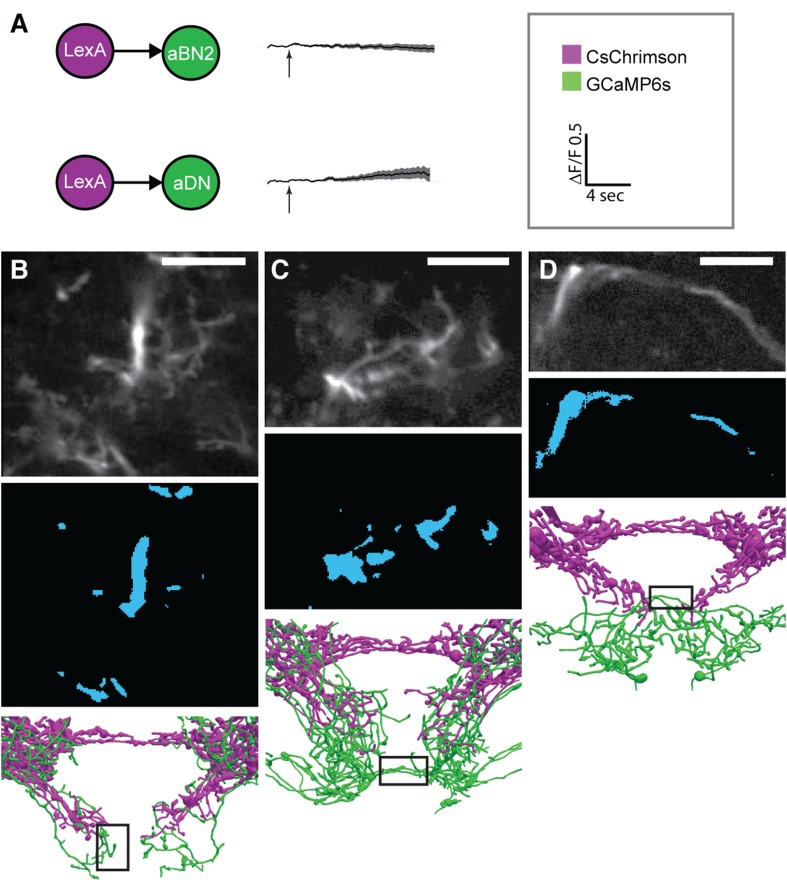
(A) Control experiments for CsChrimson/GCaMP6s activation. LexAop-CsChrimson was crossed with the control LexA driver, and GCaMP6s was expressed with aBN2-spGAL4-1 (top) or aDN2-spGAL4-2 (bottom). Flies were tested and imaging results are displayed as described in Figure 5. Average changes in fluorescence ±s.e.m. of multiple flies. (BD) Representative examples of the regions imaged for (B) aBN1, (C) aBN2, and (D) aDNs. Top panel: example average projections of an experimental run. Middle panel: regions of interest used for analysis (see ‘Materials and methods’). Lower panel: black rectangles show the approximate positions of the fields of view in each whole pattern. Scale bars, 10 μm.
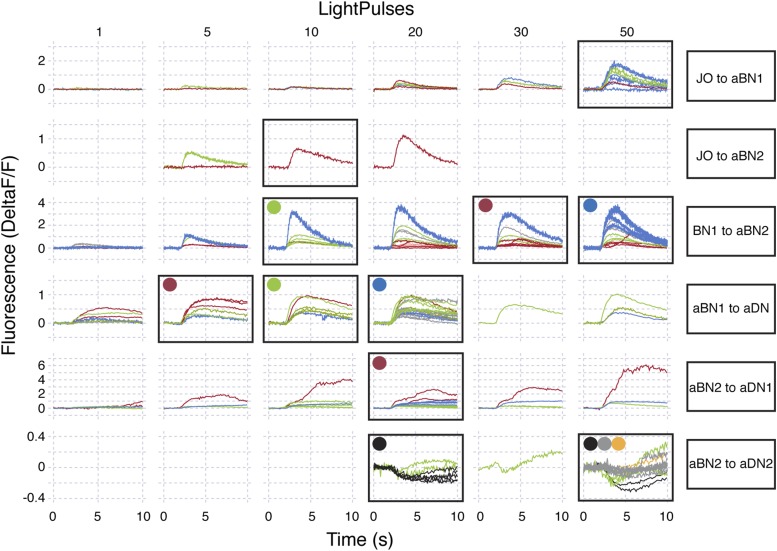
Figure 6—figure supplement 2. Raw data for functional connectivity experiments (at low intensity red light).

Figure 6—figure supplement 2.

Raw data for experiments shown in Figure 6. All experiments shown were done in the absence of drugs. Red light intensity was set at 50 μW/mm2. Each column corresponds to the number of light pulses delivered, where each light pulse was 2 ms and the interpulse intervals were 18 ms. Each trace shown is the average of four responses recorded at ∼20 s intervals. Each row represents a different genotype and colored traces in a given row correspond to an individual CNS. Multiple runs were often performed for a given CNS and set of conditions (shown by the same colored traces in a row). Black boxes show which conditions were used to generate the average traces displayed in Figure 6. All traces within the black boxes were used to generate traces shown in Figure 6A–D. For Figure 6E–I, colored dots correspond to samples that were used to generate pre-drug treatment average traces and then used for the pharmacology experiments (traces with drugs are not shown). Traces of samples used for mecamylamine experiments are marked using blue, green, red dots, whereas, those for or picrotoxin are marked using black, grey, orange dots.
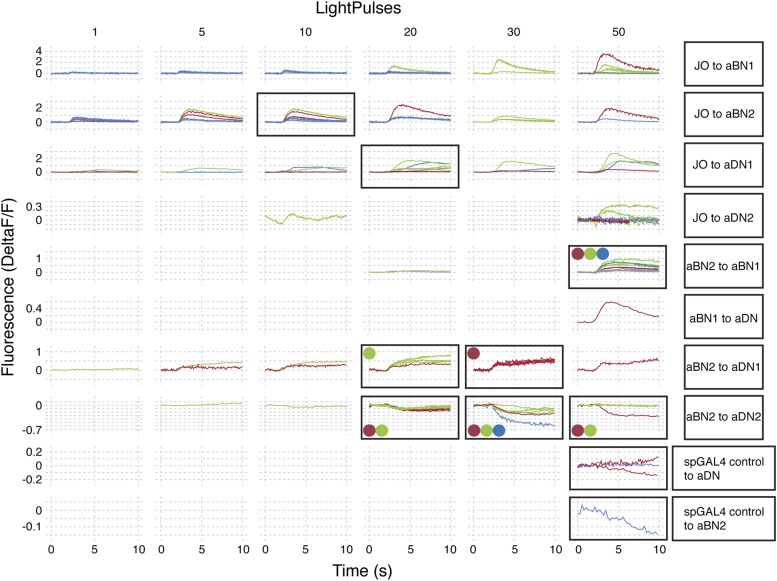
Figure 6—figure supplement 3. Raw data for functional connectivity experiments (at high intensity red light).

Figure 6—figure supplement 3.

Raw data for experiments shown in Figure 6. All experiments shown were done in the absence of drugs. Red light intensity was set betwen 290 to 700 μW/mm2. Each column corresponds to the number of light pulses delivered, where each light pulse was 2 ms and the interpulse intervals were 18 ms. Each trace shown is the average of four responses recorded at ∼20 s intervals. Each row represents a different genotype and colored traces in a given row correspond to an individual CNS. Multiple runs were sometimes performed for a given CNS and set of conditions (shown by the same colored traces in a row). Black boxes show which conditions were used to generate the average traces displayed in Figure 6. All traces within the black boxes were used to generate traces shown in Figure 6A–D. For Figure 6E–I, colored dots correspond to samples that were used to generate pre-drug treatment average traces and then used for the pharmacology experiments (traces with drugs are not shown). Traces of samples used for mecamylamine experiments are marked using blue, green, red dots, whereas, those for or picrotoxin are marked using black, grey, orange dots.