. 2015 Oct 8;12:E173. doi: 10.5888/pcd12.150183

Figure 1.

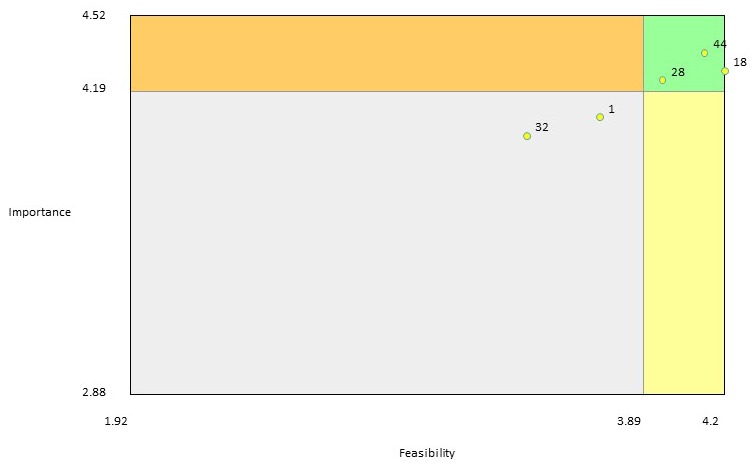
Figure 1 describes the cluster for fostering partnerships. The bivariate value plot (an x-y graph) referred to as the “go-zone” shows each statement within the cluster and how it was rated by participants for importance and feasibility (eg, 1 = relatively unimportant/not feasible, 2 = somewhat important/feasible, 3 = moderately important/feasible, 4 = very important/feasible, 5 = extremely important/feasible). Three statements (no. 18, no. 28, and no. 44) were rated above average in importance and feasibility. Two statements (no. 1 and no. 32) were rated below average in importance and feasibility. No statements were rated above average on importance and below average on feasibility, and none were rated above average on feasibility but below average on importance.

“Go zone” map for the cluster “fostering partnership” shows the average importance and feasibility rating data for the ideas included in this cluster. The right upper quadrant (green zone) represents the ideas that were rated above average on both importance and feasibility.