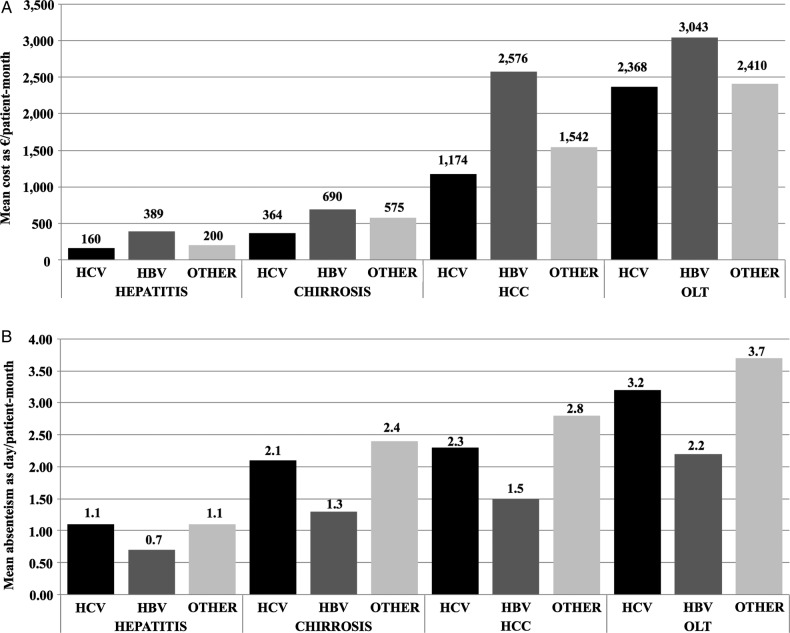
Figure 1.
Direct costs as mean €/patient-month (A), absenteeism as mean days/patient-month (B), mean EQ-5D VAS (visual analogue scale) (C), mean EQ-5D-3L utility (D) and mean EQ-5D-5L utility (E) estimated for each disease condition and aetiology, and adjusted for possible confounders. For each parameter, the bars show the trends grouped to distinguish between hepatitis, cirrhosis, hepatocellular carcinoma (HCC) and orthotopic liver transplantation (OLT) patients (groups of three bars per condition), and aetiologies (black bars for hepatitis C virus (HCV) infection, dark grey bars for hepatitis B virus (HBV) infection, light grey bars for other causes).

