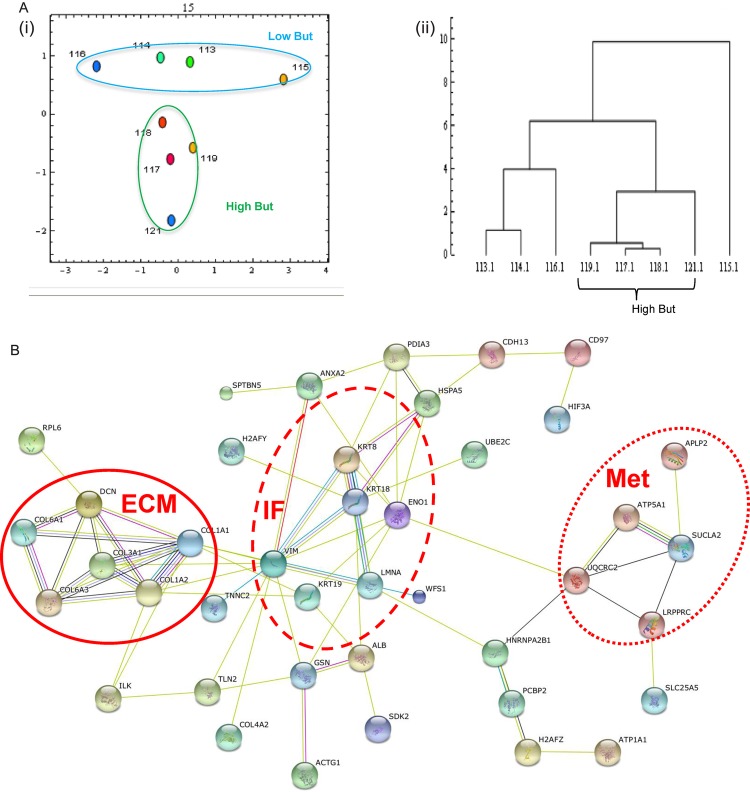
Figure 2.
iTRAQ analysis of the insoluble proteome shows effects of lesional proximity and butyrate level. Samples were separated and relatively quantified by 8-plex iTRAQ. Global analysis of the data was undertaken by principal component analysis (PCA) (panel A) and hierarchical clustering analysis (HCA) (panel B). PCA showed clustering by butyrate level with low butyrate samples in the blue oval and high butyrate in the orange oval. HCA showed the high-butyrate samples were more alike than the other samples. A protein interaction network was generated from the whole dataset (orphan nodes not shown) indicating proteins interlinked with clusters around extracellular matrix (solid line), keratins (dashed line) and metabolism (dotted line). Significant differences between samples according to lesional proximity and controlling for butyrate were computed and are shown in panel C. Proteins listed in red are significantly downregulated, while those in green are upregulated. iTRAQ, isobaric tags for relative and absolute quantification.

