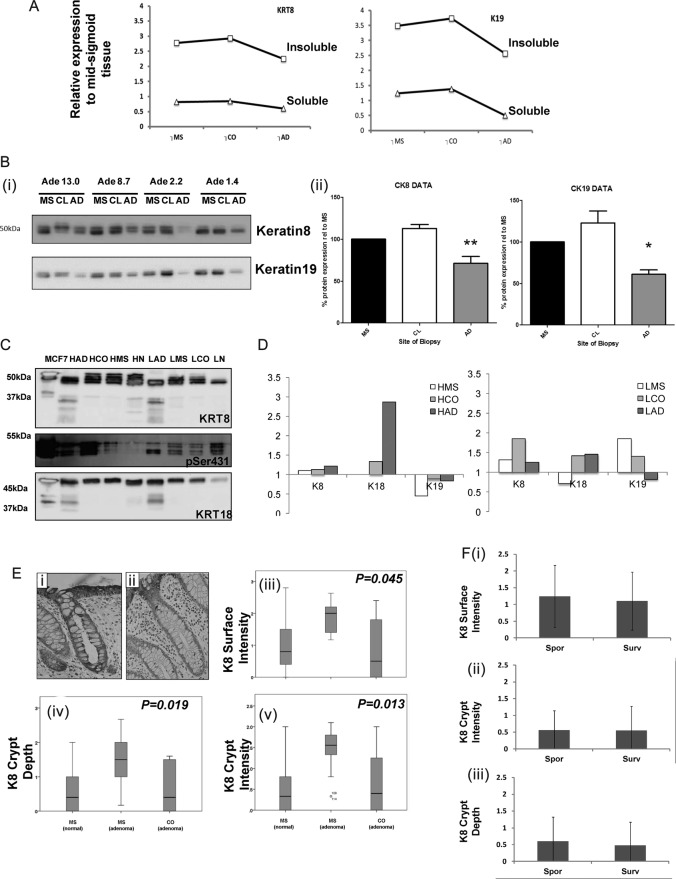
Figure 4.
Integrative analysis of changes in keratin. Data on relative expression of keratins 8, 18 and 19 are extracted from the isobaric tags for relative and absolute quantification (iTRAQ) analyses and presented in panel A to allow comparison of trends across samples. Panel Bi shows immunoblot for keratin 8 and keratin 19 of different soluble fraction pools with varying mean butyrate at the mid-sigmoid (MS), contralateral (CL) and adenoma (AD) biopsy sites. Bands were quantified by densitometry and are represented in Bii, MS is used as the reference sample, levels at the CL wall and lesion AD are shown in the white and grey bars respectively. Panel C shows immunoblot analysis of keratin 8 and 18 immunoreactivity in the insoluble fractions at varying butyrate level (high and low). Comparative analysis of trend in change in the iTRAQ data for soluble and insoluble fractions is shown in Panel D. FFPE sections were stained and scored for keratin 8. Panels Ei and Eii show representative sections for high and how scores. Three aspects of keratin organisation were scored: surface intensity, crypt intensity and crypt depth. Box-and-whiskers plots show distributions of each data for each end point between three different sample sets—mid-sigmoid (normal and adenoma) and contralateral to adenoma. All end points the data showed significant differences (Jonkheere-Terpstra). When the normal group were separated into new cases (sporadic—spor) or surveillance cases free from pathology but with a history of adenoma (surveillance) there were no significant differences between end points.

